


Serviços Personalizados
Artigo
 pdf em Inglês
 Artigo em XML
 Referências do artigo
 Enviar este artigo por email
Links relacionados
Compartilhar

 Permalink
Brazilian Journal of Oral Sciences
versão On-line ISSN 1677-3225
Braz. J. Oral Sci. vol.12 no.1 Piracicaba Jan./Mar. 2013
ORIGINAL ARTICLE
Comparison of methods to evaluate implant-abutment interface
Karina Oliveira de FariaI; Clébio Domingues da Silveira-JúniorI; João Paulo da Silva-NetoII; Maria da Glória Chiarello de MattosIII; Marlete Ribeiro da SilvaII; Flávio Domingues das NevesI
IDepartment of Occlusion, Fixed Prosthesis and Dental Materials, Federal University of Uberlandia, School of Dentistry, Uberlândia, MG, Brazil
IIDepartment of Prosthodontics and Periodontology, Piracicaba Dental School, University of Campinas, Piracicaba, SP, Brazil
IIIDepartment of Prosthodontics and Dental Materials, University of São Paulo, School of Dentistry of Ribeirão Preto, Ribeirão Preto, SP, Brazil
ABSTRACT
AIM: To compare two main methods of two-dimensional measurement of fit at the implant prosthodontic interface, testing the hypothesis that optical microscopy (OM) can reliably and efficiently scanning electronic microscopy (SEM).
METHODS: Four frameworks with four titanium abutments joined with titanium bars were used. The implant-abutment interfaces were examined by three different methods, forming 3 groups: analysis by OM (40x), and analysis by SEM at 300x and 500x. Readings were taken at the mesial and distal proximal surfaces on the horizontal and vertical axes of each implant (n=32). One-way ANOVA with a significance level of 5% was used for statistical analysis.
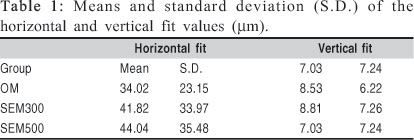
RESULTS: Neither the horizontal fit nor vertical fit values of the 3 groups presented statistically significant differences (p=0.410 and p=0.543).
CONCLUSIONS: OM was found to be an accurate two-dimensional method for abutment-framework or implant-abutment interface measurements, with lower costs than SEM. SEM micrographs at 500x presented technical difficulties for the readings that might produce different results.
Keywords: dental implant, scanning electron microscopy, methodology.
Introduction
Framework passive fit is one of the most important factors in the longevity of implant treatment1-2. The laboratory and clinical steps for denture fabrication may contribute to implant-prosthesis misfit3-4. The load on the non-passive dental prosthetic system could result in mechanical complications, such as loosening or fracture of screws, fractures of components and of the implant itself5-6, and biological complications, such as mucositis, periimplantitis7, and loss of osseointegration8. According to the literature, a perfect adaptation does not exist5, but values for vertical fit less than 10 µηι are considered acceptable3,9.
Despite several implantology studies investigating the problems arising from lack of passive fit, reliable methods for the clinical and laboratory evaluation of these interfaces have not yet been defined1,3,10. The main two-dimensional evaluation methods use optical microscopy (OM)5,11-13 and scanning electron microscopy (SEM)3-4,9-10,14-16 to measure fit at the implant-prosthesis or implant-abutment interface. OM uses a series of glass lenses to bend light waves and create a limited magnification and resolution image (spatial resolution of 50 to 100 nm), while SEM uses electrons and creates higher magnification and resolution images. Magnification refers to the degree to which a part has been enlarged.
Higher magnification does not necessarily mean better image definition, which is a factor of resolution. Resolution is the ability to distinguish between two discrete objects in an image. People in science and industry have used optical measuring and inspection techniques to get enhanced views of their products. These techniques enable users to observe, measure and analyze parts for quality control, quality assurance and other purposes. SEM is routinely used to generate high-resolution images of shapes of objects and to show spatial variations in chemical compositions.
The relative accuracy of abutment-framework or implant-abutment interface measurements generated by these two microscope types, each associated with difficulties and limitations, has not yet been determined. The lack of such comparative studies has resulted in confusion among clinicians and researchers.
This paper thus discusses these two main methods of two-dimensional measurement of fit at the implant-framework interface. The study is based on the hypothesis that SEM can be efficiently and reliably replaced by OM, simplifying and reducing the costs of studies that evaluate implant-abutment/framework interface.
Material and methods
An aluminum master cast was made in which four implants (3.75 mm diameter x 10 mm height; Master Screw, Conexão Sistemas de Próteses, São Paulo, SP, Brazil) were placed. These implants were placed parallel to each other, but at variable distances, as occurs in the majority of clinical situations.
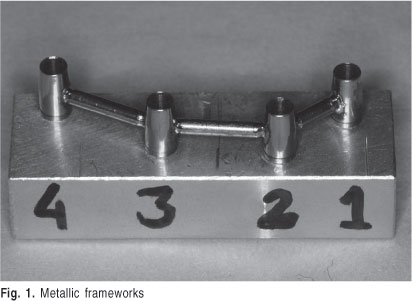
A working cast with implant analogues (013020, Conexão Sistemas de Próteses,) was fabricated from a transfer impression of the master cast. The implants were numbered from 1 to 4, from right to left. Four metallic frameworks were fabricated under this cast, using laser titanium abutments connected by titanium bars (055024 laser abutment, 400204 laser bars; Conexão Sistemas de Próteses), as shown in Figure 1.
The interfaces between the abutments and the implants were examined in three different ways, making up three study groups: OM group was analyzed with an OM at 40x magnification; the SEM300 group was analyzed by SEM at 300x magnification; and the SEM500 group was analyzed by SEM at 500x magnification. All the frameworks presented real misfits, just as in clinical practice. The values obtained for the fits based on the obtained measurements were statistically compared, showing similarity or not, and thus we determined that it was not required to create a control group with previously determined measurements for fits.
For the interface analyses, the frameworks were screwed with a tightening torque of 20 Ncm over the implants of the master cast, in the following order: implant 2, 4, 1, 3. Readings were taken at the mesial and distal proximal surfaces (n = 32) on the horizontal and vertical axes of each implant. All readings were repeated three times by the same examiner to obtain the mean value.
Optical microscopy analysis: OM group
The frameworks (A, B, C and D) were screwed onto the master cast and evaluated with an optical comparator microscope (Mitutoyo TM-500, Tokyo, Japan). The mesial and distal aspects of the abutment and implant interfaces were measured. This is a monocular microscope with two digital micrometers, 0.001 mm resolution, with an objective lens of 2x magnification and an ocular lens of 20x magnification, resulting in a 40x magnification. The microscope has a table on which the samples are positioned and moves on the X and Y axes, allowing measurement of horizontal and vertical misfits.
Scanning electron microscopy analysis: SEM300 and SEM500 groups
For SEM analysis (LEO VP-435, Carl Zeiss, Oberkochen, Germany), the samples were processed in an ultrasonic cleaner with acetone, dried and stored in a container with silica. The same procedure was done with the master cast. This microscope operates in varied pressure conditions (VP), and in the conventional way, high pressure was controlled by a computer using the Windows operating system. LOQUIF software (LEO USER INTERFACE, Carl Zeiss, Oberkochen, Germany) allows the entire process of sample examination to be done as if the user were operating a common desktop computer, with "mouse" and/or "keyboard" controls. Movement of the samples is made with a "joystick". The resulting images can be stored in a computer's hard drive or in diskettes (standard or Zip drive), and printed on a standard or thermal printer.
Magnifications of 300x and 500x were used for groups SEM300 and SEM500, respectively. The images generated during examination were stored in the computer's hard drive and then transferred to ZIP drives. The measurements were taken on the printed images, referred to the micrometer scale (ìm) printed at the base of each image.
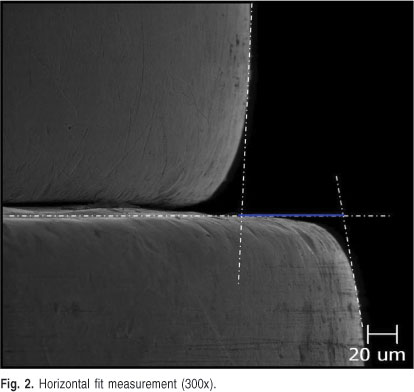
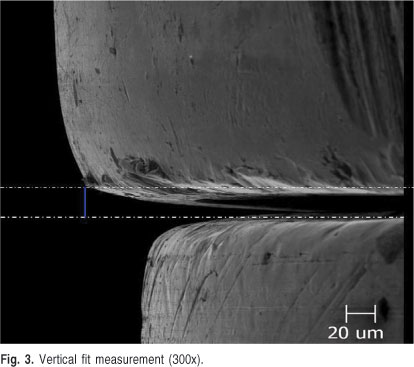
The horizontal fit measurement was made by drawing a tangent to the implant profile and one to the abutment profile, which passed through the highest number of points. A horizontal line referring to the implant radius was also drawn. Misfits were quantified by the distance between the two profile tangent intersections with this horizontal line (Figure 2). The vertical fit measurement was made by drawing a line on the implant platform and another that passes through the abutment base. Misfits were defined as the distance between these two lines, represented by a vertical line drawn perpendicular to the two horizontal lines (Figure 3).
Statistical analysis
One-way ANOVA test was used to compare data among the three groups, considering interface situations and vertical and horizontal interface values. All data analyses were performed using SPSS 12.0 for Windows (SPSS Inc., Chicago, IL, USA) and p values of less than 0.05 were considered significant.
Results
The horizontal and vertical fit values for the 3 groups are presented in Table 1. No statistically significant difference was found among the groups for either horizontal (p=0.410) or vertical (p=0.543) fit values.
Discussion
The hypothesis was confirmed as OM was proven to be an accurate two-dimensional method for interface measurements in implant systems compared with SEM.
The magnitude of the implant-abutment gap has received significant attention,1-4,8-10,12-14,16 and different methodologies have been used for such investigation3-4,9-14,16. However there is still no consensus on the most appropriate methodology1 and comparisons between methods were not performed. The present results showed that no statistically significant differences were found among the three methods used to evaluate horizontal and vertical misfits. It was noticed, however, that the interface values for both vertical and horizontal misfits were consistently larger at the highest magnification. These results might be due the technical difficulty of examining the SEM micrographs.
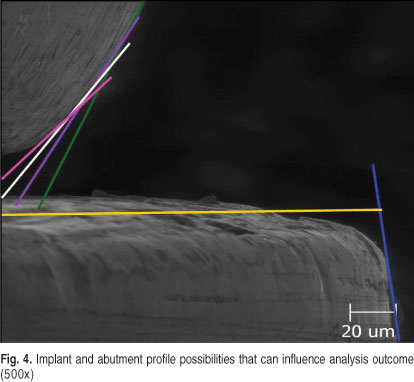
It was more difficult to define the implant and abutment profiles at higher magnifications. These profiles are necessary to guarantee correct fit measurements. For example, Figures 2 and 3 show SEM micrographs at 300x magnification. At this scale, it is easier to draw the implant and abutment profiles than with a SEM micrograph at 500x magnification. Figure 4 illustrates several profile possibilities, which can influence the outcome of the analysis. Thus, the same researcher may find different results for the same SEM micrograph. Larger misfits are also more difficult to evaluate with the SEM, as the abutment and implant profile visualization is hampered by extension of the samples beyond the visual field of the SEM micrographs.
The lower (40x) magnification used with OM in this study facilitates the visualization of the abutment and implant profiles and thus reduces the possibility of errors. This microscope shows the x and y coordinate axes in the eye lens, which facilitates measurement.
Although there is still no consensus on the acceptable fit values between implant-abutment interface3,9-10,16, the horizontal and vertical fit values found in this study showed similarity with previous studies for all analyzed methods3-4,9-13,16. The difference between the means of the horizontal misfit values evaluated by OM (34.0 ± 23.15 µm) and by SEM at 500x magnification (44.0 ± 35.4 µm) was approximately 10µm. For vertical misfit values the difference between means was even smaller, about 1.8 µm. These differences are
Within the limitations of this study, it is possible to conclude that OM is an accurate two-dimensional method for abutment-framework or implant-abutment interface measurements, with lower costs compared with SEM. It was also observed that SEM micrographs at 500x magnification presented technical difficulties to make the readings that might produce different results, depending on the reference point adopted by each researcher.
Acknowledgments
The authors would like to thank Elliot Watanabe Kitajima (NAP/MEPA - ESALQ - USP) for his assistance and permission to use SEM.
References
1. Abduo J, Bennani V, Waddell N, Lyons K, Swain M. Assessing the fit of implant fixed prostheses: a critical review. Int J Oral Maxillofac Implants. 2010; 25: 506-15. [ Links ]
2. Goodacre CJ, Bernal G, Rungcharassaeng K, Kan JY. Clinical complications with implants and implant prostheses. J Prosthet Dent. 2003; 90: 121-32. [ Links ]
3. Neves FD, Elias GA, Dantas LC, Silva-Neto JP, Mota AS, Fernandes-Neto AJ. Comparison of implant-abutment interface misfits after casting and soldering procedures. J Oral Implantol. 2012; Jan 15. [Epub ahead of print] [ Links ].
4. da Silveira-Junior CD, Neves FD, Fernandes-Neto AJ, Prado CJ, Simamoto-Júnior PC. Influence of different tightening forces before laser welding to the implant/framework fit. J Prosthodont. 2009; 18: 337-41. [ Links ]
5. Hecker DM, Eckert SE. Cyclic loading of implant-supported prostheses: changes in component fit over time. J Prosthet Dent. 2003; 89: 346-51. [ Links ]
6. Mendonça G, Mendonça DB, Fernandes-Neto AJ, Neves FD. Management of fractured dental implants: a case report. Implant Dent. 2009; 18: 10-6. [ Links ]
7. Hultin M, Komiyama A, Klinge B. Supportive therapy and the longevity of dental implants: a systematic review of the literature. Clin Oral Implants Res. 2007; 18(Suppl 3): 50-62. [ Links ]
8. Jemt T, Book K. Prosthesis misfit and marginal bone loss in edentulous implant patients. Int J Oral Maxillofac Implants. 1996; 11: 620-5. [ Links ]
9. Barbosa GA, Bernardes SR, das Neves FD, Fernandes Neto AJ, de Mattos Mda G, Ribeiro RF. Relation between implant/abutment vertical misfit and torque loss of abutment screws. Braz Dent J. 2008; 19: 358-63. [ Links ]
10. Kano SC, Binon PP, Curtis DA. A classification system to measure the implant-abutment microgap. Int J Oral Maxillofac Implants. 2007; 22: 879-85. [ Links ]
11. Costa HM, Rodrigues RC, Mattos Mda G, Ribeiro RF. Evaluation of the adaptation interface of one-piece implant-supported superstructures obtained in Ni-Cr-Ti and Pd-Ag alloys. Braz Dent J. 2003; 14: 197-202. [ Links ]
12. Koke U, Wolf A, Lenz P, Gilde H. In vitro investigation of marginal accuracy of implant-supported screw-retained partial dentures. J Oral Rehabil. 2004; 31: 477-82. [ Links ]
13. Sartori IA, Ribeiro RF, Francischone CE, de Mattos Mda G. In vitro comparative analysis of the fit of gold alloy or commercially pure titanium implant-supported prostheses before and after electroerosion. J Prosthet Dent. 2004; 92: 132-8. [ Links ]
14. Eisenmann E, Mokabberi A, Walter MH, Freesmeyer WB. Improving the fit of implant-supported superstructures using the spark erosion technique. Int J Oral Maxillofac Implants. 2004; 19: 810-8. [ Links ]
15. O'Mahony A, MacNeill SR, Cobb CM. Design features that may influence bacterial plaque retention: a retrospective analysis of failed implants. Quintessence Int. 2000; 31: 249-56. [ Links ]
16. Coelho AL, Suzuki M, Dibart S, DA Silva N, Coelho PG. Cross-sectional analysis of the implant-abutment interface. J Oral Rehabil. 2007; 34: 508-16. [ Links ]
 Correspondence:
Flávio Domingues das Neves
Department of Occlusion, Fixed Prostheses, and Dental Materials
Federal University of Uberlândia, School of Dentistry
Avenida Pará, Bloco 2B, sala 01, Umuarama
CEP: 38400-970, Uberlândia, MG, Brasil
E-mail: neves@triang.com.br
Received for publication: November 27, 2012
Accepted: March 15, 2013
