


Serviços Personalizados
Artigo
 pdf em Inglês
 Artigo em XML
 Referências do artigo
 Enviar este artigo por email
Links relacionados
Compartilhar

 Permalink
Brazilian Journal of Oral Sciences
versão On-line ISSN 1677-3225
Braz. J. Oral Sci. vol.12 no.4 Piracicaba Out./Dez. 2013
ORIGINAL ARTICLE
Bulk and surface properties related to composite filler size
Kátia GerhardtI; Andrea Soares Quirino da SilvaI,II; Guilherme RegoIII; Mário Alexandre Coelho SinhoretiIV; Vinicius Esteves SalgadoV; Luis Felipe J. SchneiderI,III
I Department of Oral Rehabilitation, Dental Materials Research Lab, Dental School, Veiga de Almeida University, Rio de Janeiro, RJ, Brazil
II Department of Restorative Dentistry, Dental School, Rio de Janeiro Federal University, Rio de Janeiro, RJ, Brazil
III Department of Restorative Dentistry, Dental School, Federal Fluminense University, Niterói, RJ, Brazil
IV Area of Dental Materials, Piracicaba Dental School, University of Campinas, Piracicaba, SP, Brazil
V Area of Dental Materials, Dental School, Pelotas Federal University, Pelotas, RS, Brazil
ABSTRACT
There are few studies that fully characterize the effect of the filler size on the surface, optical and mechanical properties of resin composites. AIM: To determine the influence of the filler size content on surface, optical and mechanical properties before and after accelerated aging. METHODS: Seven resin composites were investigated: Filtek Supreme® (3M/ESPE), EsteliteΣ Quick® (Tokuyama), Evolu-X® (Dentsply), Esthet-X HD® (Dentsply), Opallis® (FGM), Herculite XRV Ultra® (Kerr) and Filtek Z250® (3M/ESPE). Elastic modulus (EM) and flexural strength (FS) were determined by three-point bending of specimens immersed or not in absolute ethanol for seven days. Roughness (Ra) and gloss (G.U.) analyses were determined before and after ethanol storage for seven days and CIELAB color change (ΔE*) was obtained with a spectrophotometer. Results were analyzed by two-way ANOVA (general linear model) for EM and FS, with repeated measures for roughness and gloss, and one-way ANOVA for ΔE*. All comparisons were performed by Tukey's test (5%). Pearsons' correlation test was performed to determine the correlation between EM, FS, roughness, gloss, and ΔE* with the mean filler sizes. RESULTS: Mechanical properties decreased for all materials when submitted to immersion in ethanol. Increasing filler size gradually increased EM, FS and roughness values; gloss values decreased and didn't significantly affects ΔE*. Nanofiller composites presented higher gloss values than the others. CONCLUSIONS: It was possible to determine that the average filler size is a good predictor just for FS and gloss retention.
Keywords: nanocomposites, resin cements, surface properties.
Introduction
For years the increasing demand for restorative materials to mimic the dental structures has lead to the search for materials with improved physical properties. The resin composites combine adequate esthetics, acceptable lifetime and clinical performance with reasonable cost. These materials consist basically of an organic matrix and inorganic fillers, surrounded by a coupling agent. Since their introduction, almost fifty years ago, studies have been conducted in order to characterize the best composition of filler content1,2.
The shape, amount and size of the fillers employed in commercial formulations led to the establishment of different classifications of resin composite materials since 19833,4. Reported data and technological improvements addressed the broad range of formulation, properties, characteristics and esthetic possibilities for each type of resin composite. Initially, it was proposed a classification according to the average filler size as: macrofill composites (range 10-50 mm), that were difficult to polish and retain surface smoothness and microfill composites (range 40-50 nm), that exhibit inferior mechanical properties when compared to conventional composites, which are described by Ferracane4 as those composites with filler sizes that exceeded 1 μm. Associating the benefits of macrofill and microfill composites, hybrid resins composites are used universally for most anterior and posterior applications. These composites are classified as traditional hybrid composites (ranging from 10-50 mm to 40 nm), small particle hybrid minifill (0.6-1mm to 40 nm), small particle hybrid midfill (1-10 mm to 40 nm)4-6. More recently nanofill-based composites (ranging from 5 to 100 nm) were launched on the market5. The hybrid composites, due to the incorporation of different filler sizes, provide excellent mechanical properties4. The introduction of nano-scale fillers in composites might produce adequate esthetic, required for cosmetic applications, and adequate mechanical properties for posterior applications7. They combine the good mechanical strength of the hybrid composites and the polish of the microfills composites. The reduced size of the particles may improve the optical properties of composites, such as color stability, retention of the gloss and diminished wear rate5,8.
Although filler particles play an important role in the final physical properties, there are few studies that systematically characterize the effect of the fillers on the mechanical, surface and optical properties of resin composites. Therefore, the aim of this study was to assess the influence of filler size content of seven commercial resin composites on the mechanical, surface and optical properties, before and after aging.
Material and methods
Seven commercial light-cured restorative resin composites (A2 shade), with different filler sizes were analyzed: Filtek Supreme® (3M ESPES, St Paul, MN, USA), Estelite Σ Quick® (Tokuyama Dental, Tokyo, Japan), Evolu- X® (Dentsply, Catanduva, São Paulo, Brazil), Esthet-X HD® (Dentsply, Catanduva, São Paulo, Brazil), Opallis® (FGM, Joinville, Santa Catarina, Brazil), Herculite XRV Ultra® (Keer Corporation, Oragende, CA, USA) and Filtek Z250® (3M ESPES, St Paul, MN, USA). Information provided by the manufacturers is listed in Table 1. For photoactivation was employed a light-emitting-diode based unit (Ultrablue Plus, DMC, São Carlos, SP, Brazil) with light radiance of 600 mW/ cm². The light radiance, calculated by DMC, was confirmed with a hand-held radiometer (Demetron LED Radiometer, Kerr Corporation, Orange, CA, USA).

Mechanical properties analyses
Twenty bar-shaped specimens of each composite were made using a stainless steel mold (10 mm long x 2 mm wide x 1 mm thick, adapted from ISO 4049). The composite was uniquely positioned in the mold, filling the space, with cellulose acetate strips on both upper and lower sides in order to give the specimens a smooth surface. The curing time was 40 s on both sides. Ten specimens of each composite were dry stored and the other ten in absolute ethanol (Biocloro Indústria e Comércio, Campinas, SP, Brazil) immersion for seven days. Before mechanical analysis, all specimens immersed in absolute ethanol were washed and dried.
Three-point flexural test was conducted with a universal testing machine (Instron 4411, Canton, MA USA) at a crosshead speed of 0.5 mm/min, until its total collapse or failure. The software was supplied with individual data of each specimen that were previously measured with digital caliper (Digimess Instrumentos de Precisão, São Paulo, SP, Brasil). Elastic modulus "E" (GPa) and flexural strength"ó" (MPa) were measured according to ISO 4049 and were calculated according to the following formulas:

where Fmax was the fracture force (N), … the support distance (mm), b the specimen thickness (mm), h height and f (mm) the extension during loading.
Surface properties analyses
Five disk-shaped specimens of each composite were made in a stainless steel mold (8 mm diameter x 2 mm thickness). After the materials were inserted in the mold, Mylarstrips were placed below and above the orifice of the mold to obtain a smooth surface on both sides. The material was light cured for 40 s in both sides. The initial measures were obtained 24 h after curing. Then, the specimens were stored in absolute ethanol for 7 days, washed, dried and submitted to analyses of surface properties again.
A surface profiler (Surfcorder SE 1700; Kosakalab, Tokyo, Japan) to evaluate the roughness was used. The diamond stylus travelled at a constant speed of 1 mm/s across the surface with a force of 6 mN. Six line scans were performed on the top surface of each specimen, three in horizontal and three in perpendicular directions9. The cut-off length was 0.25 mm and the measuring length 2 mm. The average of all six readings per specimen was used. The amplitude parameter Ra, which relates the arithmetic mean between the peaks and valleys of the surface, was used.
The gloss was measured with a glossmeter (ZGM 1110; Zehntner GmbH Testing Instruments, Gewerbestrasse, Switzerland), which was calibrated against a black glass standard provided by the manufacturer. Measurements were performed at 60º light incidence and reflection angles relative to the vertical axis10. An average of four readings (in the center of top surface) for each sample was calculated. The measuring window employed was 4.7 mm x 2 mm.
Color measurement
Color was measured according to the CIE L*a*b* parameters in the reflectance mode, with the SCI mode11 over zero calibrating box (CIE L* = 0.0, CIE a* = 0.0, and CIE b* = 0.0) and white background (CIE L* = 93.2, CIE a* = -0.3, and CIE b* = 1.6), using a spectrophotometer with illuminating/measuring geometry d/8° (CM-2600d: Konica Minolta, Tokyo, Japan). The used measuring aperture size was 6 mm of diameter. Illuminating and viewing configurations complied with CIE 10º observer geometry and D65 illuminant. An average of three readings (in the center of top surface) for each sample was calculated. CIE L*, a*, and b* values were automatically calculated by the machine. The CIE L* axis is the brightness, where 100 is white and 0 is black. The axes CIE a* and CIE b* are the red-green and yellow-blue chromatic coordinates. A positive CIE a* or CIE b* value represents a red or a yellow shade, respectively. The initial measures were obtained 24 h after curing. Then, the specimens were stored in absolute ethanol for seven days, washed, dried and submitted again to color measurement.
The CIELAB color difference (ΔE*) was calculated from the average of L*a*b* values of each specimen by using the formula: ΔE = [(ΔL) 2 + (Δa) 2 + (Δb) 2] 1/2 where ΔL*, Δa* and Δb* are the mathematical differences between CIE L*, CIE a* and CIE b* obtained after 48 h in absolute ethanol with the initial measures.
Statistical analyses
All data was subjected to analyses of variance, general linear model for elastic modulus (EM) and flexural strength (FS), analyses of variance with repeated measures for roughness and gloss, and one-way analysis of variance for ΔE*, followed by Tukey's post-hoc test performed at a preset α of 0.0512. Pearson's correlation tests were performed to analyze the relationship between average filler size and the studied properties. It is important to mention that for Supreme was considered a value of 0.001 mm for the average filler size in order to consider the nanometric scale.
Results
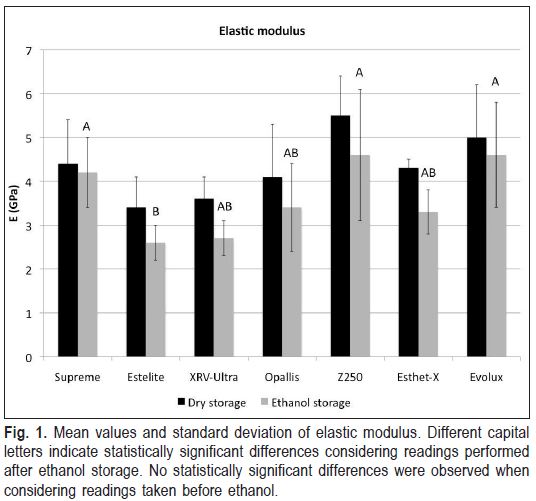
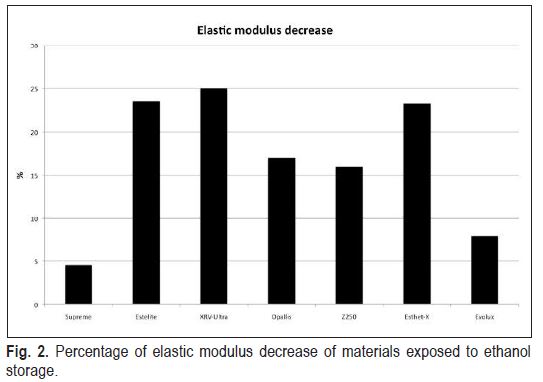
Figure 1 shows the dry and ethanol storage values of elastic modulus (EM) for all resin composites evaluated in this study. Concerning dry storage, there were no statistical differences among the tested groups. In comparison with dry storage, all materials tended to present EM loss in ethanol storage, resulting from the softened structure. However, Tukey's pairwise comparisons did not verify specific differences among the tested materials. The lowest loss percentage was observed in Filtek Supreme (p<0.05), as shown in Figure 2.
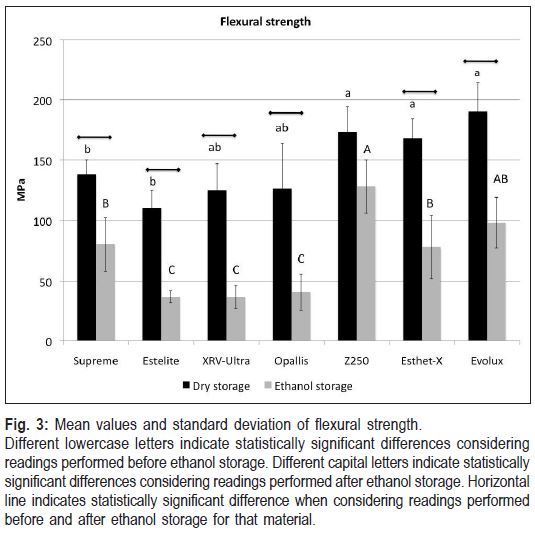
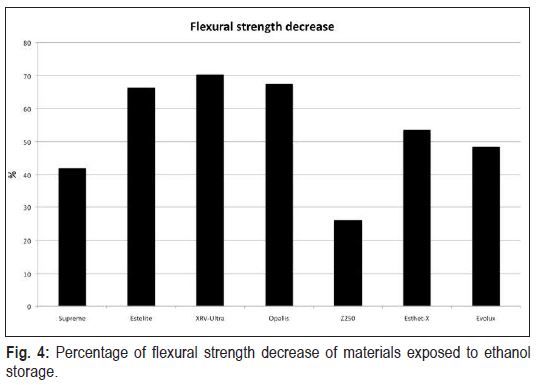
Flexural strength (FS) values are presented in Figure 3. Evolu-X presented the highest value of FS in dry storage specimens (p<0.05) while Estelite Σ Quick presented the lowest (p<0.05). With the exception of Z250, all resin composites presented lower FS values after ethanol storage and presented different FS percentage loss. As can be seen in Figure 4, XRV-Ultra exhibited the highest FS loss (p<0.05) followed by Opallis and Estelite Σ Quick, and Filtek Z250 the lowest (p<0.05).
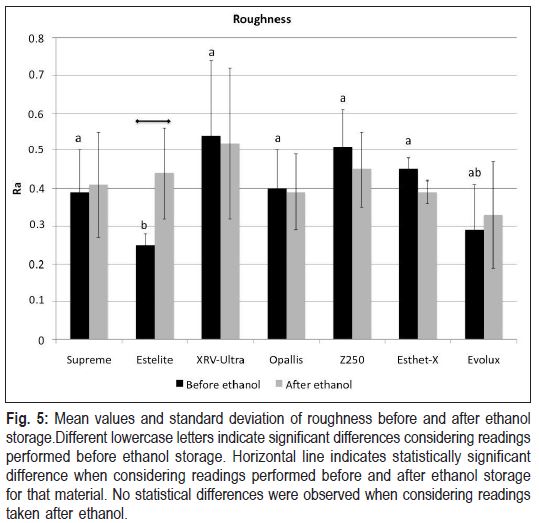
Figure 5 presents the roughness of all resin composites before and after immersion in absolute ethanol for 7 days. Different behaviors were observed between restorative materials. The only resin composite that presented significant difference after ethanol storage was Estelite Σ Quick (p<0.05), which exhibited a potential roughness increase.
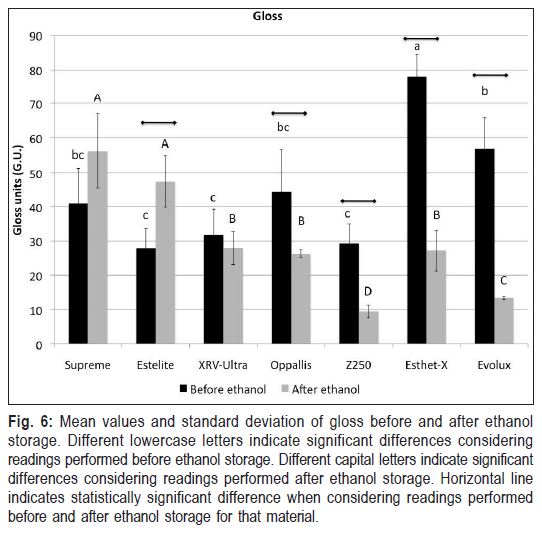
Gloss values are displayed in Figure 6. Before ethanol storage, Esthet-X presented the highest gloss (p<0.05) followed by Evolux, while Estelite Σ Quick and Filtek Z250 presented the lowest values (p<0.05). After ethanol storage, different behaviors of the groups were observed. EsteliteΣ Quick composites presented an increase of gloss values after ethanol immersion, while Opallis, Filtek Z250, Esthet-X and Evolux presented significant decrease of their values. Supreme and XRV-Ultra maintained constant values.
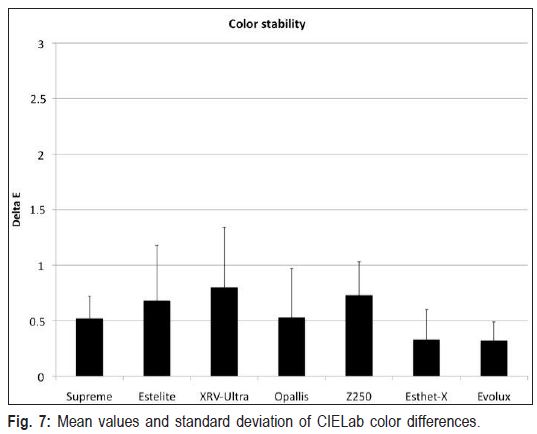
Figure 7 shows the CIELAB color difference (ΔE*) values. No significant difference was observed among the groups, despite the XRV-Ultra exhibiting the highest numerical value, while Esthet-X and Evolux, the lowest ones.
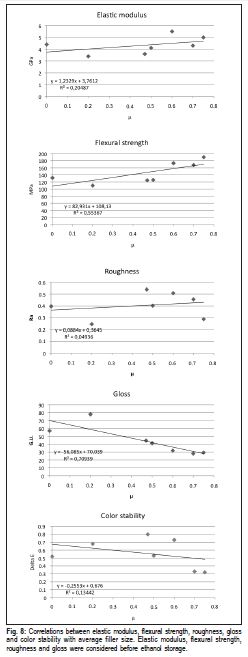
The Pearson's correlation tests demonstrated that there was a direct and significant relationship between average filler size and flexural strength (p=0.049). According to the average filler size, the elastic modulus, the flexural strength and the roughness analyses exhibited increased values as the filler size increased. In contrast, reduced filler size may lead to higher maintenance of gloss and better color stability, as shown in Figure 8, but without a significant relationship.
Discussion
The success of a composite restoration involves many factors and requirements such as color, roughness, polishing and optical properties. Many of these factors are associated with the morphological and physical characteristics of the inorganic particles, but there is lack of studies that systematically evaluate such properties before and after the degradation process. The resin composite's degradation is a process that involves several factors such wear and staining13, absorption of liquids14, polymerization15, finishing and polishing16.
All resin composites used in this study are based on Bis-GMA and, according to previous studies17 it is known that ethanol is a suitable choice of solvent to simulate the aging of dental composites. When a composite is placed in a great amount of ethanol, the monomer is released in less time than if it were placed in water.
The ethanol molecules are retained in the monomeric matrix, increasing the distance between the polymer chains, resulting in a soft matrix18 and for that reason it was employed in this study. Due to the higher amount of [-OH] present in ethanol, there is a higher absorption by the polar portion of the matrix, causing swelling of the material. This dimensional change in the matrix causes stress at the matrix-silane-filler particle interfaces, resulting in degradation of this bond. In consequence, inorganic particles detach from the surface, causing an increase in roughness and consequently reduction in the gloss of the specimens.
The present investigation demonstrated that there was no correlation between the filler size and the elastic modulus (EM). On the other hand, flexural strength (FS) was shown to be directly dependent on the average filler size. It is important to add that there is no valid information about the amount of small, medium or large particles given by manufacturers.
Regarding the information provided in Figure 1, there is a trend of EM values to increase according to the average filler size, which is likely no to occur with Filtek Supreme composite. The lowest EM percentage loss is highlighting the composite with reduced polymerization shrinkage19, due to its high content of small particles, and is well known as a true nano-based material, since its particles are made from agglomerates of nanometric fillers. Therefore, for the correlation tests was considered a value of 0.001 mm for the average filler size in order to consider the nanometric scale. If it were considered the value of 0.6 mm (stated by the manufacturer as the average filler size), a positive relationship would be established. The similar performance in EM between Filtek Z250 and Opallis composites may be related to the average filler size (0.6 μm and 0.5 μm respectively) and volume weight (60% and 58% respectively). On the basis of the above argumentation, the characteristics of nanohybrid composites, which involve nanoparticles and high filler fractions (e.g. Estelite Quick 71% vol) did not improve the elastic modulus neither the flexural strength.
The standard specimens according to ISO 4049 for flexural strength and elastic modulus would be 10 mm long x 2 mm wide x 2 mm thick. The different specimen dimensions used in this study had been previously used20, where no influence was observed in the final result. In the present study, the Herculite XRV Ultra and Opallis microhybrid composites were the most affected after immersion in ethanol considering FS, while the Filtek Z250 microhybrid composite was the least affected. It may be considered that the shape and composition of the microhybrid composites with large and irregular particles are the main reason for the lower resistance21.
Differences in gloss between a restoration and the surrounding enamel are clinically relevant, as the human eye can easily detect differences in gloss even if their color is matched22. Higher gloss that indicates smooth and highluster surface23 reduces the effect of a color difference, since the color of reflected light is predominant rather than the color of underlying composite material24. The angle of illumination affects the amount of reflected light. According to Silikas et al.10, 60º light incidence is considered more reliable from a clinical perspective, since it is closer to the perception of tooth gloss by an observer. Considering the gloss values after ethanol storage, it is clear that the material's gloss was inversely related to the filler particles' average sizes. After ethanol storage, the resin matrix of the surface is removed, exposing the surface fillers and showing that the smaller the filler size, the higher the gloss.
Previous studies used commercially available composites to study the influence of the filler size on physical properties. Janus et al.25 studied the surface roughness and morphology of a hybrid composite (Tetric Ceram, Ivoclar) and three nanocomposites (one "pure" nanofilled composite, Filtek Supreme/ 3M ESPE; and two "nano-hybrid" composites, Grandio/Voco; Synergy D6/Coltène) and verified a positive correlation between the average filler size and the surface roughness.
On the opposite, Berger et al.26 investigated the influence of filler size and finishing systems on the surface roughness and staining of three commercial dental composites ("nanofilled" Filtek Supreme/3MESPE; "minifill" Esthet-X Dentsply, and "microfill" Renamel Microfill/Cosmedent) and concluded that a smaller filler size does not necessarily result in a low surface roughness and staining susceptibility. In the same way, Gönülol and Yilmaz27 evaluated the effects of different finishing and polishing techniques on the surface roughness and color stability of commercial composites (two "nanohybrid" composites, Grandio/Voco and Aelite Aesthetic/Bisco, two "nanofillied" composites, Filtek Supreme XT/3MESPE - Dentin and Translucent, and a "microhybrid" composite, Filtek Z250/3M/ESPE) and concluded that composites with smaller filler size did not necessarily show lower roughness and discoloration than the others and, furthermore, the authors stated that staining of composite resins was dependent on monomer structure and surface irregularities. As it can be seen, studies that use commercially available composites have found conflicting results and this may be expected since such materials do not differ only in the filler content.
It is suggested that color characteristics can be assigned to the size and number of particles in a composite and its relationship with the resinous matrix. It might be considered that color change could be directly related to the load particle size. Composites with larger particles would be more susceptible to water sorption and color alteration28. On the other hand due to its nanometric particles, the nanofiller composite would demonstrate the slightest color change29 even when submitted to the effects of artificial discoloration by saliva, juice, coffee, cola soft drinks and wine30. In addition to the type of filler (glass, silica, etc.), the resin matrix can also influence the stability of color, because the more hydrophilic the material, the more opaque the color; in a hydrophobic matrix, water is less absorbed, so there is less color change12.
Dental composites with lower concentration of load particles present higher values of color change31. The CIELAB color difference represents the change in color after a designated period, and was defined as the distance between two points in space, relative to the initial and final color. With respect to the results of the current study, microhybrid composite Herculite XRV showed the highest value of color change and the highest filler average size (0.47 μm); on the contrary, nanohybrid composites Esthet-X (filler average: 0.7 μm) and Evolu-X (filler average: 0.7 μm with nanofillers) showed the highest color stability. Considering that both composites have the same manufacturer, their compositions are similar and so is the behavior.
The lack of statistically significant differences might be related to the fact that only intrinsic discoloration was considered. Further studies using extrinsic pigments are currently being developed.
In conclusion, the present investigation demonstrated that it was not possible to establish a viable correlation between bulk and surface properties with the filler classification as provided by manufacturers. Indeed, it was possible to determine that the filler average size is a good predictor for FS and gloss retention ability, as demonstrated by the correlation tests. Although it was not possible to differentiate the microhybrid, nanohybrid and "pure-nano" behaviors with respect to the studied properties in the current research, it could be observed that FS and gloss are determined by the inorganic filler average size.
References
1. Chen MH. Update on Dental Nanocomposites. J Dent Res. 2010; 89: 549-60. [ Links ]
2. Kim KH, Ong JL, Okuno O. The effect of filler loading and morphology on the mechanical properties of contemporary composites. J Prosthet Dent. 2002; 87: 642–9.
3. Lutz F, Philips RW. A classification and evaluation of composite resin systems. J Prosthet Dent. 1983; 50: 480–8.
4. Ferracane JL. Resin composite state of the art. Dent Mater. 2011; 27: 29-38. [ Links ]
5. Mitra SB, Wu D, Holmes BN. An application of nanotechnology in advanced dental materials. J Am Dent Assoc. 2003; 134: 1382-90. [ Links ]
6. Rastelli AN, Jacomassi DP, Faloni AP, Queiroz TP, Rojas SS, Bernardi MI et al. The filler content of the dental composite resins and their influence on different properties. Micro Res Tech. 2012; 75: 758-65. [ Links ]
7. Curtis AR, Shortall AC, Marquis PM, Palin WM. Water uptake and strength characteristics of a nanofilled resin-based composite. J Dent. 2008; 36: 186-93. [ Links ]
8. Ilie N, Renez A, Hickel R. Investigations towards nano-hybrid resinbased composites. Clin Oral Investig. 2013;17: 185-193. [ Links ]
9. Salgado VE, Cavalcante LM, Silikas N, Schneider LFJ. The influence of nanoscale inorganic contents over optical and surface properties of model composites. J Dent. 2013; 41: e45-53. [ Links ]
10. Silikas N, Kavvadia K, Eliades G, Watts DC. Surface characterization of modern resin composites: a multitechnique approach. Am J Dent. 2005; 18: 95-100. [ Links ]
11. Hosoya Y, Shiraishi T, Oshiro M, Ando S, Miyazaki M, Garcia-Godoy F. Color characteristics of resin composites in different color modes and geometries. J Oral Sci. 2009; 51: 123-30. [ Links ]
12. Hannigan A, Lynch CD. Statistical methodology in oral and dental research: Pitfalls and recommendations. J Dent. 2013; 41: 385–392.
13. Bagheri R, Burrow MF, Tyas M. Influence of food-simulating solutions and surface finish on susceptibility to staining of aesthetic restorative materials. J Dent. 2005; 33: 389-98. [ Links ]
14. Buchalla W, Attin T, Hilgers R, Hellwig E. The effect of water storage and light exposure on the color and translucency of a hybrid and a microfilled composite. J Prosthet Dent. 2002; 87: 264-70. [ Links ]
15. Sakaguchi RL. A review of the curing mechanics of composites and their significance in dental applications. Compend Contin Educ Dent. 1999; 20: 16-23. [ Links ]
16. Sirin Karaarslan E, Bulbul M, Yildiz E, Secilmis A, Sari F, Usumez A. Effects of different polishing methods on color stability of resin composites after accelerated aging. Dent Mater J. 2013; 32: 58-67. [ Links ]
17. Schneider LF, Moraes RR, Cavalcante LM, Sinhoreti MA, Correr-Sobrinho L, Consani S. Cross-link density evaluation through softening tests: effect of etanol concentration. Dent Mater. 2008; 24: 199-203. [ Links ]
18. Asmussen E. Softening of BISGMA-based polymers by ethanol and by organic acids of plaque. Scandinavian J Dent Res. 1984; 92: 257-61. [ Links ]
19. Gonçalves F, Kawano Y, Braga RR. Contraction stress related to composite inorganic content. Dent Mater. 2010; 26: 704-9. [ Links ]
20. Muench A, Correa IC, Grande RHM, João M. The effect of specimen dimensions on the flexural strength of a composite resin. J Appl Oral Sci. 2005; 13: 265-8. [ Links ]
21. Ilie N, Hichel R. Investigations on mechanical behavior of dental composites. Clin Oral Investig. 2009; 13: 427-38. [ Links ]
22. Ardu S, Braut V, Uhac I, Benbachir N, Feilzer AJ, Krejci I. Influence of mechanical and chemical degradation on surface gloss of resin composite materials. Am J Dent. 2009; 22: 264-8. [ Links ]
23. Kakaboura A, Fragouli M, Rahiotis C, Silikas N. Evaluation of surface characteristics of dental composites using profilometry, scanning electron, atomic force microscopy and gloss-meter J Mater Sci. 2007; 18: 155-163. [ Links ]
24. O'Brien WJ, Johnston WM, Fanian F. The surface roughness and gloss of composites. J Dent Res. 1984; 63: 685-8. [ Links ]
25. Janus J, Fauxpoint G, Arntz Y, Pelletier H, Etienne O. Surface roughness and morphology of three nanocomposites after two different polishing treatments by a multitechnique approach. Dent Mater. 2010; 26: 416-25. [ Links ]
26. Berger SB, Palialol AR, Cavalli V, Giannini M. Surface roughness and staining susceptibility of composite resins after finishing and polishing. J Esthet Restor Dent. 2011; 23: 34-43. [ Links ]
27. Gönülol N, Yilmaz F. The effects of finishing and polishing techniques on surface roughness and color stability of nanocomposites. J Dent. 2012; 40: e64-70. [ Links ]
28. Pinto GD, Dias KC, Cruvinel DR, Garcia LR, Consani S, Pires-de- Souza FP. Influence of finishing/polishing on color stability and surface roughness of composites submitted to accelerated artificial aging. Indian J Dent Res. 2013; 24: 363-8. [ Links ]
29. Lee YK. Influence of scattering/absorption characteristics on the color of resin composites. Dent Mater. 2007; 23: 124-31. [ Links ]
30. Topcu FT, Sahinkesen G, Yamanel K, Erdemir U, Oktay EA, Ersahan S. Influence of different drinks on the colour stability of dental resin composites. Eur J Dent. 2009; 3: 50-6. [ Links ]
31. Schulze KA, Marshall SJ, Gansky SA, Marshall GW. Color stability and hardness in dental composites after accelerated aging. Dental Mater. 2003; 19: 612-9. [ Links ]
 Correspondence:
Luis Felipe Jochims Schneider
Universidade Veiga de Almeida
Rua Ibituruna 108, Casa 3, CEP: 20271-020
Rio de Janeiro, RJ, Brasil
E-mail: felipefop@gmail.com
Received for publication: August 25, 2013
Accepted: December 03, 2013
