


Serviços Personalizados
Artigo
 pdf em Inglês
 Artigo em XML
 Referências do artigo
 Enviar este artigo por email
Links relacionados
Compartilhar

 Permalink
Brazilian Journal of Oral Sciences
versão On-line ISSN 1677-3225
Braz. J. Oral Sci. vol.13 no.3 Piracicaba Jul./Set. 2014
ORIGINAL ARTICLE
Evaluation of two methods for mixed dentition analysis using the method error
Bruna Santos da CruzI; Eduardo Kant Colunga RothierI; Beatriz de Souza VilellaI; Oswaldo de Vasconcellos VilellaI; Rizomar Ramos do NascimentoI
I Universidade Federal Fluminense - UFF, School of Dentistry, Department of Orthodontics, Niterói, RJ, Brazil
ABSTRACT
The most commonly used tests to assess the mesiodistal width of the unerupted permanent canines and premolars are divided in two groups: those performed directly on plaster models, using mathematical equations that can generate tables, and those using radiographs. Aim: In order to determine the reliability between two of these methodologically different method, this study evaluated the systematic and random errors of the method proposed by Tanaka and Johnston, which is based on the sum of mandibular permanent incisors, and the Huckaba method, which uses radiographs. Methods: In a random sample of 28 plaster models of mandibular dental arches belonging to individuals of both genders, aged six to eleven years old, a single investigator performed the measurement of required space, according to the two methods evaluated. After 15 days, the measurements were repeated, and each of them was performed twice in sequence to calculate the repeatability and reproducibility conditions, and the systematic and random errors for each method. Results: The random error of the method proposed by Huckaba was larger in terms of reproducibility (1.53 mm) and repeatability (0.57 mm) compared with the analysis proposed by Tanaka and Johnston (0.20 mm and 0.12 mm, respectively). Conclusions: The method proposed by Huckaba was proved to be inadequate in relation to reproducibility, with respect to the random error, and should be used with caution to measure the required space in the mandibular arch.
Keywords: dental arch; dentition, mixed; orthodontics.
Introduction
The mixed dentition analysis is a valuable tool in preventive and interceptive orthodontic treatments. It makes it possible to predict the mesiodistal (MD) width of unerupted permanent canines and premolars, and assess whether there is enough space to align these teeth on the dental arch, reducing the occurrence of crowding and deviations of the eruption pattern1-4.
Usually performed in the mandibular arch, one of the main references for orthodontic treatment planning5,6, the mixed dentition analysis is the basis for diagnosis and orthodontic treatment planning, and takes into account that the deciduous canines and molars are replaced by teeth with smaller MD width1,7. This difference in tooth size can be used to prevent or intercept future malocclusions8.
The most commonly used tests are divided in two groups: those using mathematical equations that can generate tables and those using radiographs to assess the size of the unerupted teeth1,2,9-11. The decision on the appropriate method to be used for each patient depends on certain circumstances.
Tanaka and Johnston10 (1974) developed an analysis with 75% of probability, where half the sum of mandibular incisor MD widths (x), plus a predetermined value (10.5 mm for the mandibular hemiarch), provides the likely MD width of unerupted canines and premolars (Y), being Y = x/2 +10.5 mm. The values are then duplicated to match both sides of the arch. In an initial appointment, the method proposed by Tanaka and Johnston10 (1974) has some advantages, since radiographs are not required. It employs prediction equations based on MD width of erupted permanent teeth during the mixed dentition, and it´s easy to memorize. However, this analysis tends to overestimate the size of unerupted teeth1.
On the other hand, the methods that use radiographs have the advantage of measuring unerupted teeth, and provide more accurate results, but the patient is exposed to ionizing radiation, and it requires additional radiographs, which implicates financial costs12. Huckaba9 (1964) developed a method for overcoming the effect of radiographic distortions while measuring the permanent canines and premolars MD width, using an equation relating the measures of erupted teeth to their radiographic images in order to obtain the proportional dimensions of unerupted teeth, as follows:
The Tanaka and Johnston analysis is a practical way to predict the MD width of the unerupted permanent canines and premolars, as it does not require a table and can be performed in an initial appointment or using plaster models. On the other hand, methods using radiographs have been considered more accurate, but also less practical, more expensive, more time-consuming and require specific equipment11.
Comparing these two methods for estimating the MD width of unerupted permanent teeth in the mixed dentition analysis, this study aimed to determine which one is more reliable, by assessing the method error13.
Material and methods
The present study was approved and monitored by the local ethics committee (protocol 231/10).
A total of 650 plaster casts of dental arches from the archives of the Fluminense Federal University Orthodontic Clinic (Niterói, RJ, Brazil) were examined and selected for the study, according to the following criteria:
1) mixed dentition, in which the four permanent mandibular incisors, and deciduous canines, first and second molars were present (one of the deciduous canines could be missing, since the successor was unerupted); 2) no previous orthodontic treatment; 3) complete documentation (record query, periapical radiographs); and 4) the mandibular incisors fully erupted and presenting well-defined contact areas, no cavities, malformations or restorations on the proximal surfaces. Using these criteria, 28 plaster casts were selected, belonging to patients of both genders, aged 6-11 years. Damaged models and incomplete or poor-quality radiographs were excluded.
The MD width of the mandibular permanent incisors was assessed8 using a digital caliper (Lee Tools, Brazil), with +0.02 mm accuracy, and a reproducibility of +0.01 mm on the plaster models. The caliper was positioned as perpendicular as possible to the clinical crown, with its active probes touching the proximal surfaces (mesial and distal), thus covering the largest MD width portion. When the tooth position did not allow the caliper adjustment in this way, the measurement was made with the instrument parallel to the incisal border. The sum of the widths recorded was divided by 2, and 10.5 mm were added, to estimate the size of permanent canines and premolars in one hemiarch. A 75% level of prediction was used. This digital caliper was also used to measure the MD width of deciduous teeth in periapical radiographs9 and the permanent teeth in the plaster models. Subsequently, the above-mentioned equation was used9.
To improve the reliability of the measurements, this investigation adopted some recommended procedures, such as (1) use of high-quality dental casts made of dental stone, (2) use of calipers with digital displays to greatly reduce eye fatigue and the possibility of reading error, and (3) assessing intra-examiner variability using Dahlberg´s formula14.
Measurements were carried out by an examiner calibrated by one of the supervisors of the Fluminense Federal University Orthodontic Clinic, on 10 sets of plaster models, and the intraobserver variability was assessed by measuring 10 sets of randomly selected casts twice at one-week interval. Measurements were performed following calibration and were repeated after 15 days. Each measurement was performed twice in sequence. Therefore, data were obtained in two different conditions: with an interval of 15 days between them, and in successive measurements. Subsequently, the systematic and random errors of each method were calculated for both situations.
Statistical treatment
The sample size was calculated using the formula described by Pocock and recommended by Pandis15, with 90% power levels, considering 0.05 the desired statistical significance and 0.5 mm the minimum difference to be detected. This indicates that the required sample size for the present research was 22.3. Thus, the sample used (28) is within the recommendation to carry out this study.
Bland-Altman analysis was used to compare the measurements at three different times in each method.
The paired Student's t test was used to obtain the systematic error, as recommended by Houston13, where represents the average of the differences in each of the pairs formed by the two measurements, SD corresponds to the standard deviation of the differences and n is the number of pairs of the sample, as follows:
To estimate the magnitude of the random or casual error, the following formula was proposed by Dahlberg14, where d is the difference between the two measurements and n is the number of duplicate determinations:
A significance level of 5% (p<0.05) was set for all tests.
Results
Table 1 shows the mean values of the required space, obtained in the first measurement (TJ1 and H1) and in the two subsequent measurements, performed 15 days later (TJ2A and TJ2B, and H2A and H2B), using the Huckaba method8 (H) and the Tanaka and Johnston analysis10 (TJ).
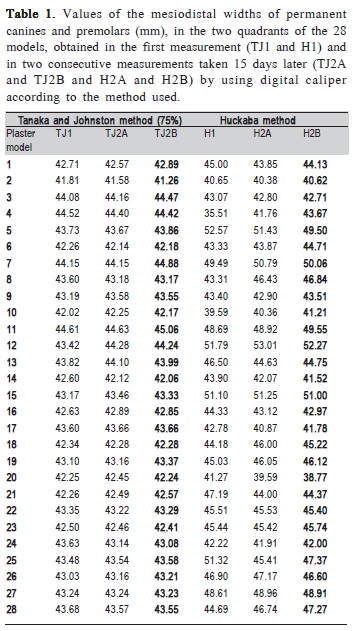
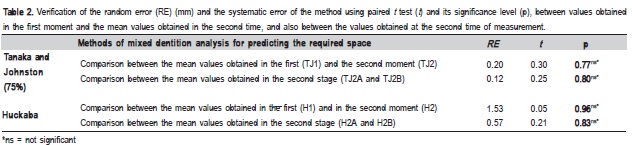
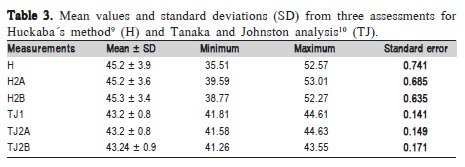
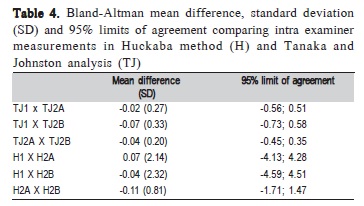
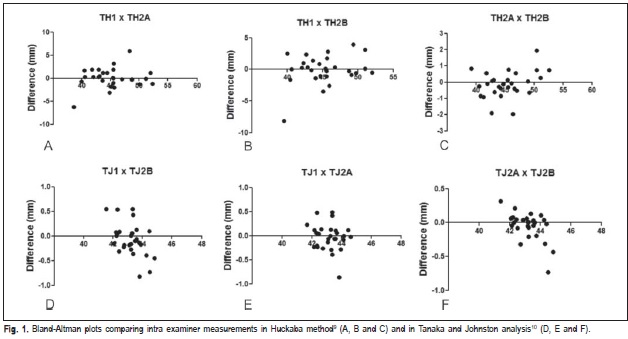
Table 2 displays the random and systematic errors in both evaluated methods. For systematic error, the Student's t test was applied to compare values obtained in the first moment and the mean values obtained at the second time, and also between the values obtained in the second measurement.
Table 3 demonstrates the mean values and standard deviations (SD) from the three assessments, and Table 4 shows Bland-Altman mean differences, standard deviations (SD) and 95% limits of agreement comparing intra examiner measurements in Huckaba method (H) and Tanaka and Johnston analysis (TJ). In Figure 1, Bland-Altman plots show correlations between first and second measurements (A; D), first and third measurements (B; E) and second and third measurements (C; F), performed for both assessed methods. A good correlation can be noted between measurements, especially in the Tanaka and Johnston analysis10.
Discussion
The random error of the method proposed by Huckaba was larger in the comparisons between the first measurements and the mean values of the second ones, as well as between the second measurements (1.53 mm and 0.57 mm, respectively), in relation to the analysis proposed by Tanaka and Johnston (0.20 mm and 0.12 mm, respectively).
An important factor to be considered in studies involving variable measurements is an adequate review of the method error. Some factors that may contribute to the test procedure variability are: the operator, the used equipment and the interval between the measurements. The present study found that the correlation between both measurements was excellent. Therefore, the intra- and interobserver error of method was considered of minor importance. This result validated the methodology employed to data collection.
Previous studies, comparing methods in which X-rays are not used, showed variable results when assessing different methods of mixed dentition analysis for different populations11,16-21. The differences in the ethnic origin of the samples and the methods of measurement may explain these findings16. Analysis based on 45o cephalometric radiographs and computed tomography scans are considered the most precise method to predict the MD widths of unerupted permanent canines and premolars16,18. However, these methods are less practical, because they are more expensive and require more time and specific equipment. These facts may explain why most researches compared methods based on tables to perform the mixed dentition analysis11. In contrast, the present study aimed to compare the reliability of two methodologically different methods, one that uses periapical x-rays and another that uses mathematical equations to predict the MD width of unerupted permanent canines and premolars, in order to identify which one has higher reliability, by assessing the method error.
An important aspect when using any measurement method is assessing its ability of repeatability and reproducibility. Repeatability occurs when there is no variation of factors that can affect the variability of the method's results, and reproducibility when at least one of these factors is varied. According to Albuquerque Jr. et al.21, reproducibility can be assessed when at least one of the factors that may contribute to the variability of results from a test method is varied21,22. The systematic error tends to overestimate or underestimate the true value of the magnitude. The random error results from unpredictable factors, such as the limitations of the equipment, the measurement procedure, or a variety of other factors, often making it impossible to accurately identify its source21,23. However, the greater the number of measurements, the algebraic sum of the differences more clearly tends to annul itself, and all these differences are subject to a probability distribution law known as the normal distribution or Gauss- Laplace curve22.
It was observed that some measurements showed a significant discrepancy between the two investigated analyses (Table 1, plaster models 5, 7, 12, 15 and 25). Two aspects can be considered in this finding. First, the discrepancy occurs in measurements between the two methods, however presents proportionality in consecutive measurements within each of them. Moreover, differently from the Tanaka and Johnston analysis, the Huckaba method uses radiographs, which can be distorted at the time of their acquisition, and this sort of error might explain the disharmony observed in this study.
It was demonstrated in this study that the systematic error showed no statistically significant differences. On the other hand, the random error of the method proposed by Huckaba9 was larger in terms of reproducibility (1.53 mm) and repeatability (0.57 mm), when compared with the analysis proposed by Tanaka and Johnston10 (0.20 and 0.12 mm, respectively). This finding could be relevant to routine clinical practice. The orthodontic planning can be modified depending on the outcome presented by the mixed dentition analysis. An error greater than one millimeter in relation to the true discrepancy, for example, may be sufficient to modify it.
In conclusion, as far as the systematic error is concerned, no significant differences were found between the methods of mixed dentition analysis. However, with respect to the random error, the method proposed by Huckaba was proven to be inadequate in terms of reproducibility, and should be used with caution to measure the required space in the mandibular arch. This suggests that care must be taken in borderline cases where the decision to extract or not teeth depends on meticulous analysis of the diagnostic elements.
Acknowledgements
This study was performed by B. S. C. as fulfillment of her PIBIC research, which was supported by grant from CNPq, Brazil.
References
1. Bherwani AK, Fida M. Development of a prediction equation for the mixed dentition in a Pakistani sample. Am J Orthod Dentofacial Orthop. 2011; 140: 626-32. [ Links ]
2. Bernabé E, Biostat C, Flores-Mir C, Orth C. Are the lower incisors the best predictors for unerupted canine and premolars sums? An analysis of a Peruvian sample. Angle Orthod. 2005; 75: 202-7.
3. Oliveira MV, Pithon MM, Ruellas ACO. Comparative evaluation of three methods for the calculation of request space in the mixed dentition analysis. J Dent Sci. 2007; 22: 148-53.
4. Rubin RL, Baccetti T, McNamara Jr. A. Mandibular second molar eruption difficulties related to the maintenance of arch perimeter in the mixed dentition. Am J Orthod Dentofacial Orthop. 2012; 141: 146-52.
5. Melgaço CA, Araújo MTS, Ruellas ACO. Mandibular permanent first molar and incisor width as predictor of mandibular canine and premolar width. Am J Orthod Dentofacial Orthop. 2007; 132: 340-5.
6. Paranhos LR, Andrews WA, Jóias RP, Bérzin F, Daruge Júnior E, Triviño T. Dental arch morphology in normal occlusions. Braz J Oral Sci. 2011; 10: 65-8.
7. Zilberman O, Huggare JAV, Parikakis KA. Evaluation of the validity of tooth size and arch width measurements using conventional and three dimensional virtual orthodontic models. Angle Orthod. 2003, 73: 301-6.
8. Tome W, Ohyama Y, Yagi M, Takada K. Demonstration of a sex difference in the predictability of widths of unerupted permanent canines and premolars in a Japanese population. Angle Orthod. 2011; 81: 938-44.
9. Huckaba GW. Arch size analysis and tooth size prediction. Dent Clin North Am. 1964:11: 431-40.
10. Tanaka MM, Johnston LE. The prediction of the size of unerupted canines and premolars in a contemporary orthodontic population. J Am Dent Assoc. 1974; 88: 798-801. 11. Burhan AS, Nawaya FR. Prediction of unerupted canines and premolars in a Syrian sample. Prog in Orthod. 2014; 15: 4.
12. Ritshel R, Bechtold TE, Berneburg M. Effect of cephalograms on decisions for early orthodontic treatment. Angle Orthod. 2013; 83: 1059-65.
13. Houston WJB. The analysis of errors in orthodontic measurements. Am J Orthod. 1983; 83: 382-90.
14. Dahlberg G. Statistical methods for medical and biological students. New York: Interscience; 1940.
15. Pandis N, Polychronopoulou A, Eliades T. Sample size estimation: an overview with applications to orthodontic clinical trial designs. Am J Orthod Dentofacial Orthop. 2011; 140: e141-6.
16. Brito FC, Nacif VC, Melgaço CA. Mandibular permanent first molars and incisors as predictors of mandibular permanent canine and premolar widths: applicability and consistency of the method. Am J Orthod Dentofacial Orthop. 2014; 145: 393-8.
17. Dasgupta B, Zahir S. Comparison of two non-radiographic techniques of mixed dentition space analysis and their evaluation of their reliability for Bengali population. Contemp Clin Dent. 2012; 3: 146-50.
18. Legovic M, Novosel A, Scrinjaric T, Legovic A, Mady B, Ivancic N. A comparison of methods for predicting the size of unerupted permanent
19. Miyamura ZY, Tubel CAM, Ciruffo PAD, Paludo AH. Prediction of mesiodistal diameter of permanent canines and premolars unerupted. Evaluation of methods of Moyers and Tanaka & Johnston. Rev Gaucha Orthodontol. 2006; 54: 52-7.
20. Philip NI, Prabhakar M, Arora D, Chopra S. Applicability of the Moyers mixed dentition probability tables and new prediction aids for a contemporary population in India. Am J Orthod Dentofacial Orthop. 2010; 138: 339-45.
21. Albuquerque HR Jr, Santos-Pinto A, Santos-Pinto LAM. Precisão de medidas cefalométricas: validade de métodos de ensaio. Dental Press J Orthod. 2002; 7: 57- 62.
22. Machado LA, Vilella OV, Agostinho LMAG. Evaluation of two techniques to measure the available space in the mandibular dental arch using the method error. Rev Odonto Cienc. 2012; 27: 228-32.
23. Mendes AJD, Santos-Pinto A. Algumas diretrizes estatísticas para avaliação do erro do método na mensuração de variável quantitativa. Rev Dental Press Ortod Ortop Facial. 2007; 12: 78-83.
 Correspondence:
Rizomar Ramos do Nascimento
Departmento de Ortodontia - UFF
Rua Mário Santos Braga, 30, 2° andar, Centro
CEP: 22050-001 Niterói - RJ - Brasil
E-mail: rizonascimento@gmail.com
Received for publication: March 20, 2014
Accepted: August 08, 2014
