


Serviços Personalizados
Artigo
 pdf em Inglês
 Artigo em XML
 Referências do artigo
 Enviar este artigo por email
Links relacionados
Compartilhar

 Permalink
RSBO (Online)
versão On-line ISSN 1984-5685
RSBO (Online) vol.13 no.1 Joinville Jan./Mar. 2016
ORIGINAL RESEARCH ARTICLE
Measurement of Spee curve in individuals with temporomandibular disorders: a cross-sectional study
Glaucia Marques Dias I; Letícia Ladeira Bonato I; Patrícia Rocha Coelho I; Josemar Parreira Guimarães I; Rafaela Ladeira Bonato I
I Department of Dentistry, Federal University of Juiz de Fora – Juiz de Fora – MG – Brazil
ABSTRACT
Introduction: Several factors are cited as capable to influence the development of Temporomandibular Disorders (TMD), among them, the psychological, systemic, genetic, and occlusal factors. The curve of Spee is the factor directly related to the TMJ. However, the combination of variations in amplitude, and the presence of signs and symptoms of TMD have not been investigated. Objective: The aim of this study was to measure the curve of Spee in patients with TMD, through the use of study models, comparing these values with the different clinical and symptomatic presentations of such individuals. We evaluated 198 models of patients treated at the care service for patients with TMD at UFJF. The maximum depth of the curve was determined by the sum of the distances between the lowest part of the buccal cusp of the posterior teeth of each hemiarch to a reference plane, using a caliper to measure. The following factors were considered: gender, presence of myalgia (temporal, masseter, medial pterygoid, lateral and sternocleidomastoid muscles) and TMJ arthralgia, and the presence of occlusal interferences and parafunctional habit of bruxism. For statistical analysis, we used T-test and ANOVA test with a significance level of 5%. Conclusion: There was a statistically significant association between the presence of occlusal interferences and changes in the curve (p = 0.01). There was no association between the following factors: the presence of myalgia and/or arthralgia, gender, achievement of bruxism, and the type of TMD presented with changes in the Spee curve.
Keywords: temporomandibular joint dysfunction syndrome; dental occlusion; curve of Spee; myofascial pain syndromes.
Introduction
Temporomandibular disorders (TMD) are presented as one of the chronic orofacial pain conditions faced by most dentists and other health professionals 7. However, its multifactorial character and its heterogeneous forms 15 contribute to the diagnosis and treatment is still considered controversial issue among professionals 15.
Several factors are cited as capable to influence the disorder development. They are classified as initiators, predisposing and / or perpetuating 15,19,26. Among the main factors are: the psychological 24 and systemic factors 24, individual pain symptomatology 24, genetic aspects 24 and parafunctional habits, as bruxism 24,26. The role of occlusion in TMD development was discussed for long time; however, statistics association does not prove causality. Currently, it is believed that occlusal alterations cause TMD and not only related to its development 26. Among them, the Spee curve is little valued and studied, and the literature lacks longitudinal correlation studies on the causal and/or consequent role of TMD.
The Spee curve is a curve line at anteriorposterior direction, determined by the tangency of the buccal cusp tips from molars to canine teeth. Normally, the Spee curve is concave, at the level of the mandibular teeth, and convex at the level of the maxillary teeth; the lowest point was the mesialbuccal cusp of the mandibular first molar 8,20. At the sagittal view, the Spee curve touches the area from the anterior surface of the mandibular condyles to the occlusal surface of the mandibular teeth 25. Thus, the normal inclination is important because it provides greater free movements during the mandibular functional excursions 13,14,26, increases the masticatory effectiveness 1,17,20,21,26, and accounts to compensate the condylar paths. Thus, the correct intercuspation is assured, avoiding premature contacts and the disclusion of the posterior teeth during the protrusion is enabled 1,8,9,10,20.
However, characteristics such as horizontal positioning of the mandibular condyle in relation to the occlusal plane 8,9,10, TMJ morphology 9,10, direction of the occlusal forces on the posterior teeth 9, less vestibularization of the incisors 5 and less arch circumference 5 may contribute to alter the Spee curve. Also, the Spee curve can be also altered with aging, mainly related to the greater condyle rotation, articular degeneration, and dental extrusions 8,17.
In young individuals, most of the cases in which the Spee curve is excessively inclined, it is believed an association with marked overbite 2,10,17,20. Concomitantly, flatten Spee curve due to orthodontic treatments results in prevalence of art icular sounds 14 and TMJ pain 11. Bruxism also challenges the dentists. Depending on the severity of the tooth weariness affects the periodontium, masticatory muscles, and TMJ 22. Consequently, such alterations directly influence on the Spee curve 14, altering not only the inclination, but also developing occlusal interferences, no disclusion of the posterior teeth during protrusion, and increasing the pressure on the mandibular condyle 8,9,10,20,21.
It is worth highlighting that when the Spee curve was altered, the patients complained about TMJ function and the alteration in the Spee curve can be either cause or consequence 1. Thus, the dentist should be aware of this sagittal compensation curve, avoiding its alteration, correcting if the Spee curve is altered. Accordingly, it is believed that it is possible to decrease the frequency of patients' complaints 11 and preserve the anatomic and physiologic components of all stomatognathic system 8,11,13,21.
This study aimed to measure the Spee curve in patients with TMD and compare the values with the presence of muscle and articular pain. Also, we verified a possible association between the curve alterations with the presence of occlusal interferences and bruxism.
Material and methods
This study was submitted and approved by the Institutional Review Board in relation to ethical aspects under protocol no. #511.434.
This was a descriptive, observational, crosssectional study analyzing 198 files and study casts of individuals with TMD treated at the TMJ Service of the School of Dentistry of the Federal University of Juiz de Fora since 2004. Inclusion criteria comprised permanent dentition, not undergoing orthodontic treatment, not presenting tooth loss, presence of the file completely filled. The individuals not fulfilling these criteria were excluded from the study.
The methodology of this study was divided into five stages:
1st stage – Assessment of the muscle and articular pain
The characteristics of pain were analyzed from the files, based on reports of arthralgia, and pain in muscles associated with TMJ. The following muscles were evaluated bilaterally: temporal, masseter, medial pterygoid, lateral pterygoid, and sternocleidomastoid muscles. The muscle palpation was performed through small round movements performed with the forefinger and/or middle finger tips with pressure of 1 kg for extraoral muscles and 0.5 kg for intraoral muscles, in which the patient reported the presence or absence of pain.
The presence of articular pain was verified by examining the lateral poles of this joint. The exam was performed bilaterally, with the forefinger and/or middle finger tips with pressure of 0.5 kg.
2nd stage – Clinical diagnosis of TMD
The diagnosis of this disorder type is based on the clinical files of the patients, grouped according four diagnoses: I) muscle alterations, II) articular disc position alterations, III) TMJ algic and degenerative conditions, and IV) multiple diagnoses.
3rd stage – Evoluation of the presence of occlusal interferences
The presence of occlusal alterations was executed by observing the lateral excursive movements (right and left) and protrusion.
4th stage – Assessment of bruxism parafunctional habit
The presence of centric and eccentric bruxism was also assessed through the files. The diagnosis of this parafunctional habit was based on the International Classification of Sleep Disorders (ICSD) 12, associated with clinical inspection and the patient's self-report.
All aforementioned stages were performed by calibrated and trained examiners.
5th stage – Measurement of Spee curve
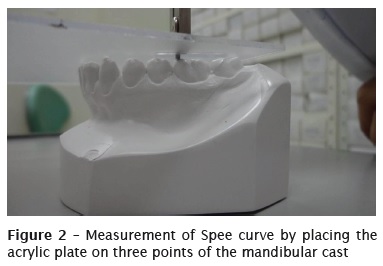
Based on the analysis of study casts of the patients, the Spee curve deepness was measured. The study casts were obtained previously to TMD treatment, in dental plaster and sent to the same laboratory. The maximum deepness was determined by the sum of the distances between the lowest buccal cusp tip of the posterior teeth of each hemi-arch and the reference plane. This reference plane was obtained by supporting an acrylic plate on three points of the mandibular cast: the distalbuccal cusps of the right and left second molars and the most evident incisal edges of the inferior central incisors. If a tooth prevented the contact of the acrylic plate with one of the points, the lower surface of the plate was worn until the three contact points were obtained 5,6.
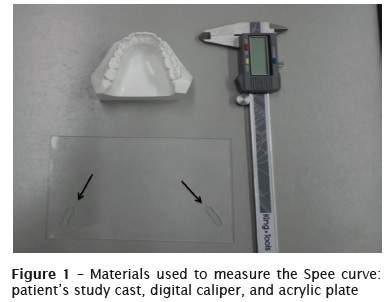
The distance between the acrylic plate and the lowest buccal cusp tips in each hemi-arch was then measured with the aid of a digital caliper (Kingtools® 150 mm, São Paulo/SP) placed on the acrylic plate, passing through a perforation (figures 1 and 2). Because the caliper and the mandibular cast was in contact with the opposed surfaces of the acrylic plate, the thickness was subtracted (1.7 mm) from the measurement found to obtain the cusp deepness 5,6.
Descriptive statistics was used to describe the sample profile. The hypothesis of data normality was verified by Kolmogorov Smirnov test. To compare the values among the paired groups, Student t test was applied with level of significance of p<0.05 and 95% confidence interval. ANOVA was used to compare data between two or among more groups. The calculations were performed through STATA 11.0 software for Windows.
Results
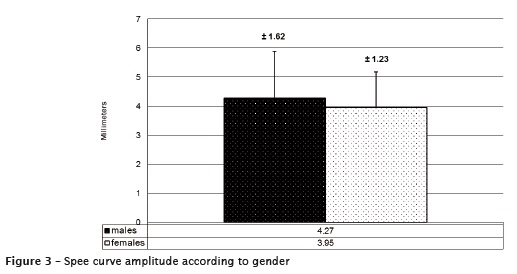
The sample was composed by 45 males (22.72%) and 153 females (77.27%). The Spee curve was analyzed by the sum of the right and left measurements. In females, the mean deepness was 3.95 (±1.23mm), while in males the mean deepness was 4.27 (±1.62) mm (figure 3).
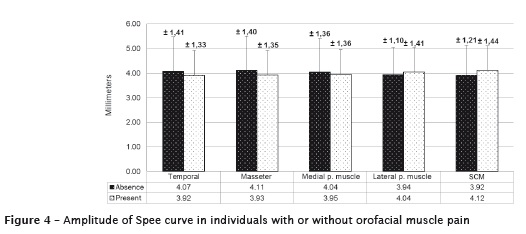
According to the muscle assessment, in the group with pain complaint, the mean values were 3.92 (±1.33) mm for temporal muscle, 3.93 (±1.35) mm for masseter muscle, 3.95 (±1.36) mm for medial pterygoid muscle, 4.04 (±1.41) mm for lateral pterygoid muscle, and 4.12 (±1.44) mm for sternocleidomastoid muscle. Of these, 105 individuals (53.03%) showed pain on temporal muscle, 136 (68.68%) pain on the masseter muscle, 132 (66.66%) pain on medial pterygoid, 138 (69.69%) on lateral pterygoid, and 97 (48.98%) pain on sternocleidomastoid muscle. In the group without muscle pain, the values were respectively of 4.07 (±1.41) mm (93 individuals; 46.96%); 4.11 (±1.40) mm (31.31%); 4.04 (±1.36) mm (32.82%) 3.94 (±1.10) mm (29.29%), and 3.92 (±1.21) mm (51,01%) (figure 4).
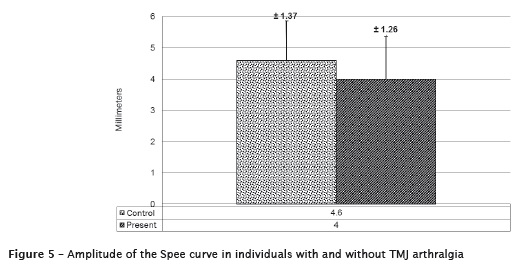
Concerning to the evaluation of the presence or absence of arthralgia, 135 individuals (68.18%) complained about pain with Spee curve value of 4.00 (±1.37) mm, while 63 participants (31.81%) did not complain about arthralgia, with value of 4.6 (±1.26) mm (figure 5).
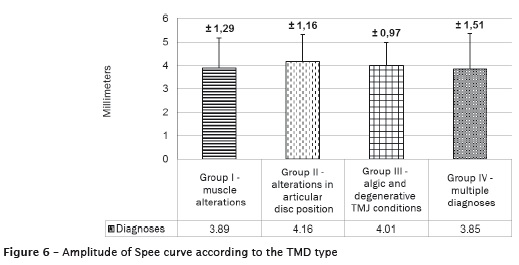
The Spee curve deepness was still correlated with the clinical diagnosis group. In group I (muscle alterations), the value found was of 3.89 (±1.29) mm; in group II (alterations in articular disc position) was of 4.16 (±1.16) mm; in group III (algic and degenerative TMJ conditions) was of 3.85 (±0.97) mm. Because for one individual, multiple diagnoses can be performed, the Spee curve was also considered in these cases, with value of 4.09 (±1.51) mm (figure 6). 58 individuals comprised group I (29.29%), 25 (12.62%) group II, 20 (10.10%) group III, and 95 (47.97%) showed more than one diagnosis.
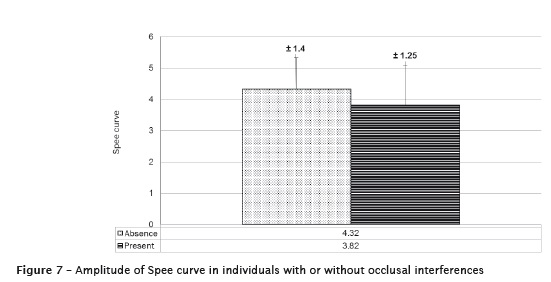
When the excursive movements were analyzed, those showing any type of occlusal interference (120 individuals; 60.60%) had a mean value of Spee curve of 3.82 (±1.25) mm, while those without occlusal interferences (78 individuals; 39.39%) had a mean value of 4.32 (±1.4) mm (figure 7).
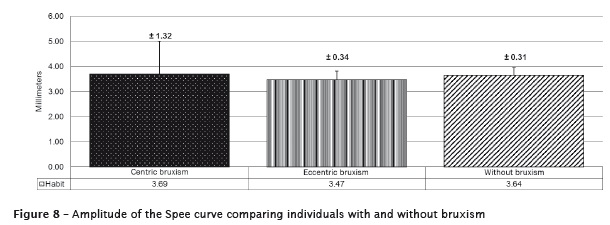
The presence of bruxism was also considered with a mean values of the Spee curve of 3.68 (±1.31) mm in those with centric bruxism, 3.47 (±0.33) mm in those with eccentric bruxism, and 3.64 (±0.3) mm in those without bruxism (figure 8). 30 individuals (15.15%) had centric bruxism, 9 had eccentric bruxism (4.5%) and 61 (30.80%) without bruxism.
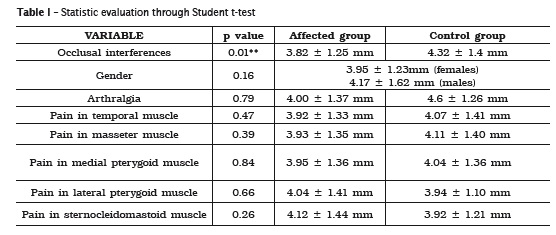
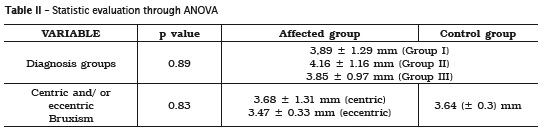
Data normality was verified by Kolmogorov Smirnov test. Then, Student t-test was applied to compare the values of paired groups with level of significance of 5% (table 1). Anova was used to compare the data among more than two groups (table 2). After the comparisons, considering the variations in the Spee curve, the presence of occlusal interferences was statistically significant (p=0.01). According to this study, the characteristics as pain symptoms, bruxism, and TMD type was not statistically capable of influencing the curve values.
Discussion
This study sample was selected according to normality criteria, aiming that no unfavorable anatomic, functional, or systemic factor influence on the results 14. The participants should have permanent dentition, because only after the eruption of the permanent second molar the Spee curve is inclined and marked. In deciduous and mixed dentures, the occlusal plane is flattened which was not the aim of this study 17. Participants with tooth losses and those underwent orthodontic treatment were also excluded because these factors significantly alter the occlusal plane by flattening it 2,8,11,12,13. Concerning the sample, this was determined by analyzing the files for a period of 10 years. We considered a variation between the right and left curves of 0.1 mm, and α= 0.05 and β= 0.85. It is worth highlighting that regardless of the statistically significant differences, we considered the results indicative of flattening or tendency towards steepness of the curve because the literature lacks a normal value.
According with Kanavakisa and Mehtab 14 and Hernández et al. 11, when the Spee curve is flattened TMJ pain complain report is more prevalent. Corroborating such affirmation, in this present study, although without statistically significant differences, the individuals with TMJ arthralgia had more flattened Spee curves (4.00 ± 1.37 mm) than those without TMJ pain complaint (4.6 ± 1.26 mm). Concomitantly, the Spee curve was f lattened in individuals who had pain in the following muscles at the beginning of TMD treatment: temporal (3.92 ± 1.33 mm), masseter (3.93 ± 1.35 mm), and medial pterygoid (3.95 ± 1.36 mm). In the group of those without pain, the values of the Spee curve was, respectively: 4.07 ± 1.41 mm; 4.11 ± 1.40 mm, and 4.04 ± 1.36 mm. The pain presence was considered when present in at least one of the sides. In contrast, during the palpation of the sternocleidomastoid and lateral pterygoid, the Spee curve was increased in those reporting pain (4.04 ± 1.41 mm for lateral pterygoid muscle and 4.12 ± 1.44 mm for sternocleidomastoid muscle) than in those without pain (3.94 ± 1.10 mm and 3.92 ± 1.21 mm, respectively).
However, it is worth noting that measurement biases could have occurred during the palpation of such muscles 23. The sternocleidomastoid muscle is close to the lymph nodes. If these lymph nodes were infarcted due to different processes (for example, viral infection), the individual would respond positively to palpation 23. Similarly, the lateral pterygoid palpation is questioned because of the anatomic difficult for digital palpation of this muscle, which have many superimposed structures, generating a high number of false-positive cases 23.
Still according to the aforementioned study 11, the Spee curve is steep in males. In this present study, the females had more flattened curves (3.95 ± 1.23 mm) than males (4.27 ± 1.62 mm), 77.27% of the sample. Demonstrably, females had more TMD signs and symptoms and more prevalence of chronic pain 3,19, which could be related to the variation of such occlusal curve. However, due to the lack of longitudinal studies evaluating the Spee curve, the greater prevalence of symptomatology in females should be understood not only as the consequence of alterations in the curve, but also as a possible cause, which causes many alterations in all stomatognathic system 26.
The presence of premature contacts may also act as predisposing factor for TMD and may be related to Spee curve alterations 8,9,10,20,21. The influence of such interferences proved in this study (p=0.01), that is, individuals with any type of occlusal interference (3.82 (±1.25) mm) compared with the other group (4.32 (±1.4) mm). Thus, as in previous cited studies 8,9,10,20,21, it is believed that the tendency towards flattened of Spee curve may cause the development of occlusal interferences and these may act on triggering TMD 11,14, because they are capable of affecting the blood flow in such joint, resulting in changes in articular joint and inducing nociceptive muscle responses associated with the peripheral sensitization. This sensitization may lead to the development of central sensitization that maintains the masticatory muscle hyperalgesia 27. It is worth highlighting that the results of this study corroborates this information because the individuals who had myalgia and those who had occlusal interferences showed more flattened Spee curve, which reinforces the theory that this variables are related 14. However, this is a cross-sectional study and it is not possible to affirm that the occlusal interferences accounted for TMD development or if occlusal interferences were a consequence. It is only possible to affirm their relationship.
Notwithstanding, we highlighted that the factors capable of promoting considerable occlusal changes is bruxism 14,22. In this present study, the individuals with eccentric bruxism had decreased Spee curve (3.47 (±0.33) mm) compared with those with centric bruxism (3.68 (±1.31) mm) and those without bruxism (3.64 (±0.30) mm). This result is according to the literature because tooth weariness is one of the signs more frequently found in patients with eccentric bruxism 16-18. Thus, despite of no statistically significant differences, the relationship of bruxism with the other aforementioned variables (occlusal interferences and orofacial pain report) should be taken into account by the dentists 14.
According with previous studies, Kanavakisa and Mehtab 14, Hernández et al. 11 and Fernandez et al. 10, it is believed that the steep Spee curve is related with condyles more anteriorly positioned; flatten Spee curve is related with more posterior condyles , which predisposes to the development anterior articular disc displacement and articular sounds 14. However, the results of this study were different from this affirmation 13. The Spee curve was more steep in those with alterations in the articular disc (4.01 (±0.97) mm), and more flattened in group I – muscles alterations (3;89 (±1.29) mm). The smallest value was in group III (3.85 (±0.97) mm). Thus, we believed that in this group possible degenerative processes act as triggering factors for flattening the curve, promoting the development of occlusal interferences and orofacial pain 8, and TMD – a painful, cyclic, and multifactorial process.
Conclusion
Based on the results, it can be suggested that the presence of occlusal interferences in patients with TMD acted as a factor capable of influencing the Spee curve. In contrast, no stat ist ically significant differences were found by assessing the following characteristics: presence of myalgia and/or arthralgia, gender, bruxism, and TMD type.
We highlight that the literature lacks studies on this area which made difficult to compare the values and to stablish a cause-effect relationship among factors. We suggest that further studies are necessary.
References
1. Ali IM, Yamada R, Alkhamrah B, Vergara R, Hanada K. Relationship between occlusal curvatures and mandibular deviation in orthodontic patients with temporomandibular disorders. Journal of Oral Rehabilitation. 2003;30:1095-103. [ Links ]
2. Ahmed I, Nazir R, Gul-e-Erum, Ahsan T. Influence of malocclusion on the depth of curve of Spee. J Pak Med Assoc. 2011;61:1056-9.
3. Bagis B, Ayaz EA, Turgut S, Durkan R, Özcan M. Gender difference in prevalence of signs and symptoms of temporomandibular joint disorders: a retrospective study on 243 consecutive patients. Int J Med Sci. 2012;9(7):539-44.
4. Barbosa TS, Miyakoda LS, Pocztaruk RL, Rocha CP, Gavião MB. Temporomandibular disorders and bruxism in childhood and adolescence: review of the literature. International Journal of Pediatric Otorhinolaryngology. 2008;72:299-314.
5. Braun S, Hnat WP, Johnson BE. The curve of Spee revisited. Am J Orthod Dentofacial Orthop. 1996;110:206-10.
6. Campos MJS, Quintão CCA, Fraga MR, Vitral RWF. Avaliação do espaço adicional requerido no perímetro do arco inferior para o nivelamento da curva de Spee. R Dental Press Ortodon Ortop Facial. 2009 Jul/Aug;4(14):129-36.
7. Celic R, Jerolimov V, Zlataric DK. Relationship of slightly limited mandibular movements to temporomandibular disorders. Braz Dental J. 2004;15(2):151-4.
8. D'Souza M, Kamath G, Mohan M, Parolia A. Comparative evaluation of the curve of Spee in two age groups and its relation to posterior teeth disclusion. Indian Journal of Dental Research. 2011 Jan/Mar;22(1):179.
9. Farella M, Michelotti A, van Eijden TMGJ, Martina R. The curve of Spee and craniofacial morphology: a multiple regression analysis. Eur J Oral Sci. 2002;110:277-81.
10. Fernandez DM, Cunillera ER, Rabi GR, Zuluaga CLG, Medina CMA. Relación entre la curva de Spee y la angulación de la cavidad glenoidea. Revista Archivo Médico de Camagüey. 2013 Mar/ Apr;2(17):201-14.
11. Hernández RC, Abalo RG, Mart ín FC. Associação das variáveis oclusais e a ansiedade com a disfunção temporomandibular. Jornal Brasileiro de Oclusão, ATM e Dor Orofacial. 2001 Apr/Jun;2(1):134-7.
12. International Classification of Sleep Disorders Revised (Diagnostic and Coding Manual). American Academy of Sleep Medicine.
13. Ito H, Okimtito K, Mizuniori T, Terada Y, Maruyania T. A clinical study of the relationship between occlusal curvature and craniomandibular di sorde r s . The Int e rnat ional Journal of Prosthodontics. 1997;1(10):78-82.
14. Kanavakisa G, Mehtab N. The role of occlusal curvatures and maxillary arch dimensions in patients with signs and symptoms of temporomandibular disorders. Angle Orthod. 2014 Jan;84(1):96-101.
15. Kaur H, Datta K. Prosthodontic management of temporomandibular disorders. J Indian Prosthodont Soc. 2013 Oct/Dec;13(4):400-5.
16. Khan F, Young WG, Daley TJ. Dental erosion and bruxism. A tooth wear analysis from South East Queensland. Australian Dental Journal. 1998;43(2):117-27.
17. Kumar KS, Tamizharasi S. Significance of curve of Spee: an orthodontic review. Journal of Pharmacy and Bioallied Sciences. 2012 Aug;6(4):323-8.
18. Lurie O, Zadik Y, Einy S, Tarrasch R, Raviv G, Goldstein L. Bruxism in military pilots and non-pilots: tooth wear and psychological stress. Aviation, Space, and Environmental Medicine. 2007 Feb;2(78):137-9.
19. Oral K, Bal Küçük B, Ebeoğlu B, Dinçer S. Etiology of temporomandibular disorder pain. Temmuz. 2009 July;21(3):89-94.
20. Shannon KR, Nanda RS. Changes in the curve of Spee with treatment and at 2 years posttreatment. Am J Orthod Dentofac Orthop. 2004;125:589-96.
21. Re JP, Perez C, Giraudeau A, Ager P, El Zoghby A, Orthlieb JD. Reconstruction of the curve of Spee. Stomatologie. 2008;105:29-32.
22. Rodrigues CK, Ditterich RG, Shintcovsk RL, Tanaka O. Bruxismo: uma revisão de literatura. UEPG Ci Biol Saúde. 2006 Sep;12(3):13-21.
23. Silva RS, Conti PCR, Araújo CRP, Rubo JH, Santos CN. Palpação muscular: sensibilidade e especificidade. Jornal Brasileiro de Oclusão, ATM e Dor Orofacial. 2003;3(10):164-9.
24. Slade GD, Fillingim RB, Sanders AE, Bair E, Greenspan JD, Ohrbach R et al. Summary of findings from the OPPERA prospective cohort study of incidence of first-onset temporomandibular disorder: implications and future directions. The Journal of Pain. 2013 Dec;14(12):T116-T24.
25. Spee FG. The gliding path of the mandible along the skull. J Am Dent Assoc. 1980;100:670-5.
26. Türp JC, Schindler H. The dental occlusion as a suspected cause for TMDs: epidemiological and etiological considerations. J Oral Rehabil. 2012;39:502-12.
27. Xie Q, Li X, Xu X. The difficult relationship between occlusal interferences and temporomandibular disorder – insights from animal and human experimental studies. Journal of Oral Rehabilitation. 2013;40:279-95.
 Corresponding author:
Letícia Ladeira Bonato
Universidade Federal de Juiz de Fora – Faculdade de Odontologia
Rua José Lourenço Kelmer, s/n – Martelos
CEP 36045-070 – Juiz de Fora – MG – Brasil
E-mail: leticialbonato@hotmail.com
Received for publication: December 1, 2015
Accepted for publication: March 4, 2016
