


Services on Demand
Article
 pdf in English
 Article in xml format
 Article references
 Send this article by e-mail
Related links
Share

 Permalink
Brazilian Journal of Oral Sciences
On-line version ISSN 1677-3225
Braz. J. Oral Sci. vol.15 n.2 Piracicaba Apr./Jun. 2016
ORIGINAL ARTICLE
Diagnostic performance of fractal dimension and radiomorphometric indices from digital panoramic radiographs for screening low bone mineral density
Angela Jordão CamargoI; Arthur Rodriguez Gonzalez CortesI; Eduardo Massaharu AokiI; Marina Gazzano BaladiI; Emiko Saito AritaI; Plauto Christopher Aranha WatanabeII
I Universidade de São Paulo – USP, School of Dentistry, Department of Stomatology, University of São Paulo, São Paulo, SP, Brazil
II Universidade de São Paulo – USP, Ribeirão Preto Dental School, Department of Stomatology, Area of Public Oral Health and Forensic Dentistry. Ribeirão Preto, SP, Brazil
ABSTRACT
A number of panoramic radiographic measurements have been associated with osteoporotic alterations. However, little is known about the differences in sensitivity and specificity among these measurements for screening low bone mineral density (BMD). Aim: To correlate and compare precision, sensitivity and specificity of panoramic radiomorphometric indices and fractal dimension (FD) for screening low BMD (i.e. osteopenia and osteoporosis). Methods: Sixty-eight female patients (42.78±15.59 years) were included in this study. Body mass index (BMI), mandibular cortical index (MCI), mandibular cortical width (MCW), FD and connectivity (C) were assessed. Low BMD was diagnosed by peripheral dual-energy X-ray absorptiometry (p-DXA). Non-parametric correlations were assessed among all variables. In addition, sensitivity and specificity of MCI, MCW and FD were estimated for screening low BMD. Results: Significant correlation was found between FD and BMI (p=0.013; r=0.269). In addition, FD was the most sensitive method for screening low BMD (70.8%, p=0.001). FD and MCI presented a significant and relatively high sensitivity, whereas MCW presented a high specificity for screening low systemic BMD. Conclusion:Among the analyzed methods, FD and MCI offer a significant and relatively high sensitivity, whereas MCW offers a high specificity for screening low BMD.
Keywords: Radiography, Panoramic. Osteoporosis. Mandible.
Introduction
Osteoporosis is a major health problem and affects a significant number of people. This skeletal disorder is characterized by bone fragility due to deterioration of the bone micro-architecture, which is related to bone strength and quality1,2. Screening for osteoporosis is currently recommended for all women over 65 years old, since the complications of this disease may be prevented by early detection1. Diagnosis is currently based mainly on bone mineral density (BMD) measurements using dual-energy X-ray absorptiometry (DXA), considered the "gold standard" method. However, bone densitometry is expensive and has limited availability for use in population screening3,4. Furthermore, BMD assessment alone does not allow for predicting osteoporotic fractures, since BMD values may overlap between cases with and without fractures. Accordingly, cases with osteopenia also present high rates of bone fractures5. Other clinical parameters such as body mass index (BMI)6 and trabecular micro-architectur7 have also been associated with BMD. Such parameters may also provide useful information for the diagnosis of osteoporotic alterations and prediction of bone fractures6,7.
Several studies have demonstrated that individuals with osteoporotic alterations present altered mandibular morphology. Furthermore, there is evidence that intraoral and panoramic radiographic findings may be indicators of both osteopenia and osteoporosis1,6-12. The BMD of the mandible was correlated with the BMD of the lumbar spine and femoral neck, in osteopenia and osteoporosis cases8.
Panoramic radiography (PR) stands out in this context because it is commonly used as the initial dental examination. Furthermore, it is fast, low-cost and uses low-dose X-radiation. PR is useful to diagnose systemic13 and alveolar14 bone quality by assessing the shape (i.e. mandibular cortical index – MCI) and width of the inferior mandibular cortex at the mental foramen (i.e. mandibular cortical width – MCW). These measurements have been used as indices to predict osteopenia and osteoporosis since they are correlated with systemic bone mineral density (BMD) values measured with DXA15.
It is also possible to assess bone morphometric parameters such as trabecular area, connectivity and fractal dimension (FD) on PR images. Moreover, FD of trabecular bone has been associated with bone strength16,17. However, little is known about the difference in diagnostic performance among the above-mentioned methods. Thus, the aim of this study was to assess the diagnostic performance of panoramic radiomorphometric indices and parameters in detecting low bone density.
Material and methods
Sixty-eight PR images of female patients referred to dental treatment (42.78±15.59 years) were included in this study. Patients had a minimum age of 30 years and were indicated to BMD assessment. Other metabolic disorders were considered as exclusion criteria. Demographic data including age and body mass index (BMI) were recorded for all patients. All digital PR images (Veraviewepocs 2D, Morita, Tokyo, Japan) were performed with the same exposure conditions (60 kV, 4 mA, 0.5-mm copper filter). All patients willing to participate in this study signed an informed consent form. Approval for conducting retrospective analyses was obtained from the Ethics Committee of the University of São Paulo. The Standards for the Reporting of Diagnostic accuracy studies (STARD) and the guidelines of the Helsinki Declaration were followed in this investigation.
Trabecular Pattern Analysis
Morphometric analyses of the trabecular bone pattern was performed using the methodology proposed by a previous study18, using an imaging processing software (ImageJ, National Institutes of Health, Bethesda, MD). The morphological factors assessed were FD, using a box-counting method and connectivity.
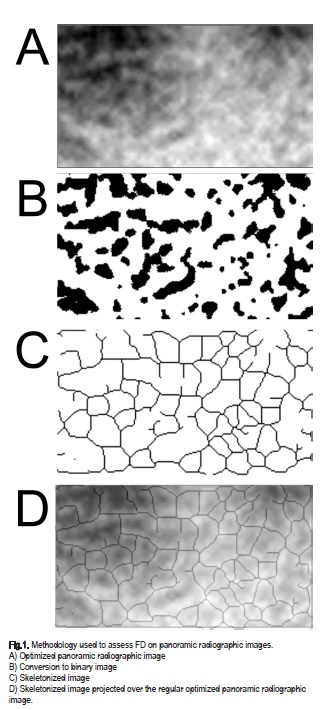
First it was selected the region of interest (ROI). The choice was a rectangular selection tool, in a fixed manner, measuring 230 X 130 pixels located in the region of the mandibular body below the right mandibular canine tooth apex. This selection avoids overlapping anatomical structures such as the mental foramen, genis apophyses and regions of masticatory stress (premolars and molars)19. Thus, the same size rectangular pictures were cut in all PR20. The chosen ROI in the images of digital PR included the region of the mandibular body, anterior to the mental foramen and posterior to the mandibular symphysis. The trabecular pattern was analyzed in the ROI using the ImageJ software. The following steps were followed18: 1) ROI image duplication; 2) Image blurring (from Gaussian image) with 33 radius (pixels) - this step removes all the fine and medium scale structures and retains only large variations in density (low-pass filter); 3) Image subtraction - The blurred image was subtracted from the original of the same patient; 4) Adding - This step adds a constant to each pixel of the resulting subtracted 8-bit image (256 pixel values), according to the image histogram. This generates an image by thresholding on a mean pixel value of 128, thus segmenting the image into components that radiographically approximate the trabeculae and marrow (Fig. 1A), according to a previous methodology18; 5) The image is then converted to binary image (Fig. 1B). 6) The resulting image is then eroded and 7) dilated to reduce noise. 8) Next, the image of the trabeculae is inverted to make the trabecular pixels visible and 9) skeletonized, that is, automatically eroded by using a specific software tool so that only the central line of pixels remains visible (Fig. 1C). Superimposition of the skeletonized trabecular image on the original image of the bone demonstrates that the studied skeletal structure corresponds to the trabeculae of the original image (Fig. 1D).
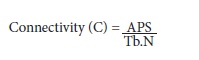
The skeletonized images from each patient were saved in TIFF format. Using the resulting images, the ImageJ software did the following analyses: measurement of the average particular size (APS), and trabecular number (Tb.N). The values of the aforementioned analyses are associated with the connectivity of the trabecular meshwork. Therefore, a ratio of those parameters was proposed to facilitate the analysis, according to the following equation:
Mandibular Cortical Width (MCW)
The MCW was measured at both mental foramen regions according to a previous methodology15. Briefly, images were corrected using a magnification factor of 1.3. Spatial calibration was set at a scale of 1 pixel per 96 mm. Then, a line tangential to the inferior border of the mandible was drawn. A line perpendicular to this tangent intersecting the inferior border of the mental foramen was drawn, along which the MCW was measured. Mandibular Cortical Index (MCI) MCI was assessed by evaluating the appearance of the cortical bone below the mandibular foramen, using a previously described classification21. Briefly, the inferior mandibular cortex was classified as follows: C1 = normal, when it presented an even and distinct endosteal margin; C2 = moderately eroded, presenting evidence of lacunar resorption or endosteal cortical residues; and C3 = severely eroded, when unequivocal porosity was observed12.
Bone Mineral Density (BMD)
Bone densitometry measurements were carried out in peripheral dual energy X-ray absorptiometry (pDEXA, Norland; Norland Medical Systems, Inc., White Plains, NY, USA). The scanning resolution was 1.00 X 1.00 mm, prior to scanning. The radiation dose was less than 0.03 mSv for each examination. The region of choice for scanning was the distal forearm22,23. The chosen region of interest was defined as a rectangle with a fixed longitudinal size of 20 mm and a lateral extension large enough to cover both radius and ulna. Its distal margin was defined to be coincidental with the location where the ulna and the radius start to superimpose. Patients were diagnosed based on BMD values of the forearm, measured according to World Health Organization (WHO) criteria, as normal (T score > -1.0), osteopenic (T score, -1.0 to -2.5) and osteoporotic (T-score ≤ -2.5 SD)24.
Statistical Analysis
Sample size was determined using the uncorrected chisquare test, to detect a minimum diagnostic odds ratio of 5 and to give the study a power of 80%, at a 5%significance level.
All panoramic radiomorphometric measurements were performed in random order by two trained observers (i.e. dentists with expertise in oral radiology). Intra-observer reliability was assessed by measurements performed 2 weeks apart to eliminate memory bias. Intra and inter-observer agreement was assessed using the intraclass correlations coefficient (ICC) and the kappa test for MCW and MCI, respectively.
Normality for continuous variables was assessed using the Shapiro-Wilk test. Correlation analyses were performed among all demographic (age and BMI) and clinical variables (DXA, MCI, MCW, FD and C) analyzed in the study, using the Spearman's test. A diagnostic performance analysis was conducted to address the sensitivity and specificity of each imaging examination for screening low BMD (i.e. cases with either osteopenia or osteoporosis that have been included in the same category, following a previously described methodology)21. Fisher's exact test was calculated to address the significance of each diagnostic test. All variables were stratified using cutoff points. For continuous variables, mean cut-off points were chosen. For MCI, "C1" category was chosen as the cut-off point, since this is the only category representing the lack of alterations in the inferior mandibular cortex21.
All statistical analyses were performed at a 5% significance level , using IBM SPSS Statistics 17 (SPSS®, Inc, Chicago, IL, USA).
Results
Sixty-eight PR images were analyzed. Mean BMI for participants was 25.04±4.61 kg/m2. Ten patients were diagnosed with osteoporosis (T-score≤-2.5 SD), while 41 patients were diagnosed with osteopenia (T score, -1.0 to -2.5). As a result, 51 patients were included in the category of low BMD, considered in the diagnostic performance analyses (i.e. sensitivity and specificity). The remaining 17 patients presented normal BMD (T score>-1.0). All cases were considered in the correlation analyses.
Normality was rejected for all variables, according to the Shapiro-Wilk test (p<0.05). Intra-observer reproducibility and inter-observer reliability were confirmed for the MCW (ICC=0.87, p=0.001), as well as for MCI categorical measurements (kappa=0.83, p=0.01).
T-score from DXA was significantly correlated with MCW (r=0.215; p=0.039) and MCI (r=0.238; p=0.026). In addition, BMI was significantly correlated with trabecular connectivity (r=0.269; p=0.013). No other correlations were significant (p>0.05).
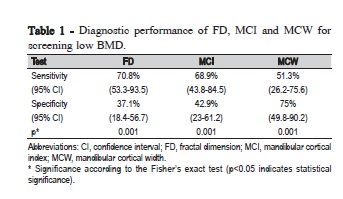
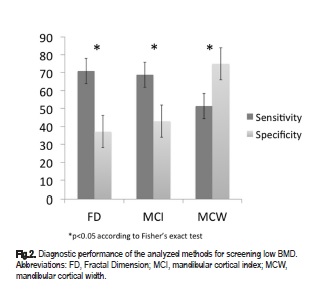
Diagnostic performance analysis (Table 1 and Fig. 2) revealed a higher sensitivity and a lower specificity of FD (70.8% and 37.1%, respectively) as compared with MCI (68.9% and 42.9%, respectively) and MCW (51.3% and 75%, respectively) for screening low BMD. Fisher's exact test analysis revealed a significant association between the aforementioned three variables and the T-score outcome (p=0.001).
Discussion
Despite the lack of contrast and image resolution, as compared with morphometric laboratorial methods, the literature has suggested that panoramic radiographic images could be useful to assess trabecular bone characteristics12,14,18,21. This is the first study proposing a formula to address trabecular bone connectivity from digital panoramic radiographic images, using specific software tools. However, trabecular bone density may be underestimated on panoramic radiographs due to a modified window level from the imaging software, as well as a number of parameters from the panoramic radiographic device. Variations in parameters such as kVp, exposure time, mA and different image receptors, as well as the presence of soft tissue may affect the radiographic assessment of the trabecular pattern18. On the other hand, radiomorphometric methods such as MCI and MCW are less susceptible to methodological variations25 and are well described by studies on bone mineral density10,18,26-34. This finding is supported by the present study, according to the significant correlations and satisfactory diagnostic performance results using the above-mentioned radiomorphometric indices.
A previous study found sufficient evidence that the trabecular pattern affects individuals with either medium or high risk of osteoporosis35, using periapical radiographs. Accordingly, it was found a significant correlation between BMI and connectivity using PR images, which are useful as initial examination at patient's first attendance36. This result suggests that, in addition to weight-bearing bones, low BMI could also affect the trabecular structure of the mandible. Despite these results, no significant non-parametric correlation between FD and DXA results could be found. A previous study11 concluded that T-scores below or equal to -1 classify the patient with low bone mineral density and at risk for osteoporosis.
WHO defines osteoporosis as "a disease characterized by low bone mass and deterioration of bone microarchitecture, leading to increased bone fragility and a consequent increase in fracture risk"24. Thus, evaluating the conditions of trabecular bone may have an effect on the analysis of maxillofacial bone quality. According to the present diagnostic performance results, FD and MCI presented a high sensitivity and average specificity, whereas MCW presented an average sensitivity and high specificity for screening osteoporotic alterations. Therefore, none of these methods may be considered accurate and reliable enough to be used solely in the final diagnosis of osteoporosis, which agrees with a previous study37. However, our significant results (p<0.001) also suggest that a combination of the analyzed methods could yield better and more accurate results. Further diagnostic studies with larger sample sizes could be recommended to test the diagnostic performance of a combination of the above-mentioned tests, in comparison with laboratorial morphometric measurements and DXA.
A limitation of this study is that the present diagnostic performance analyses were conducted to screen low BMD, which includes diagnoses of both osteopenia and osteoporosis. This is in accordance with a previous methodology for relatively small sample sizes21. Another limitation of this study is that only posterior mandibular ROIs were included in the analyses, which could influence the results since BMD may vary from site to site38. Further studies would also be recommended to test and compare different ROIs from different regions, in association with systemic bone density.
The morphological filter used in this study was similar to the one used by Kumasaka (1997) for extracting skeletal pattern of trabecular bone on images from non-digital panoramic radiographic devices, which were transformed into binary images with enhanced geometric components10,18,26. Accordingly, our results support that digital panoramic radiographs, which use lower radiation doses, are also useful for bone density assessments. Variations of the present methodology have been described by studies on periapical radiographs, commonly used during dental treatments18,39-45. In addition, the chosen ROI is free of artifacts resulting in images with higher details to assess trabecular skeletal pattern. On the other hand, further studies are required to compare and define the most accurate binary processing threshold in order to enhance the technique and obtain adequate results. This technique has also been described as useful for the computer-assisted analysis of bone structure, which assesses, for instance, the prognosis following surgery, or even to follow-up certain medical treatment outcomes26,39.
In conclusion, among the analyzed tests, FD and MCI have a significant and relatively high sensitivity, whereas MCW has a high specificity for screening low systemic bone density. Furthermore, the diagnostic performance outcomes and significant correlations found in this study suggest that it is possible to obtain evidences of the trabecular bone pattern by assessing panoramic radiographic images.
References
1. O'Connor KM. Evaluation and treatment of osteoporosis. Med Clin North Am. 2016 Jul;100(4):807-26. doi: 10.1016/j.mcna.2016.03.016. [ Links ].
2. Paolucci T, Saraceni VM, Piccinini G. Management of chronic pain in osteoporosis: challenges and solutions. J Pain Res. 2016 Apr 1;9:177- 86. doi: 10.2147/JPR.S83574.
3. Maricic M. Use of DXA-based technology for detection and assessment of risk of vertebral fracture in rheumatology practice. Curr Rheumatol Rep. 2014 Aug;16(8):436. doi: 10.1007/s11926-014-0436-5.
4. Silva BC, Leslie WD, Resch H, Lamy O, Lesnyak O, Binkley N, et al. Trabecular bone score: a noninvasive analytical method based upon the DXA image. J Bone Miner Res. 2014 Mar;29(3):518-30. doi: 10.1002/ jbmr.2176.
5. Dargent-Molina P, Piault S, Breart G, Grp ES. A comparison of different screening strategies to identify elderly women at high risk of hip fracture: results from the EPIDOS prospective study. Osteoporos Int. 2003 Dec;14(12):969-77.
6. Kang D, Liu Z, Wang Y, Zhang H, Feng X, Cao W, et al. Relationship of body composition with bone mineral density in northern Chinese men by body mass index levels. J Endocrinol Invest. 2014 Apr;37(4):359-67. doi: 10.1007/s40618-013-0037-6.
7. Friedman AW. Important determinants of bone strength - Beyond bone mineral density. J Clin Rheumatol. 2006 Apr;12(2):70-7.
8. Alonso MBCC, Cortes ARG, Camargo AJ, Arita ES, Haiter-Neto F, Watanabe PCA. Assessment of panoramic radiomorphometric indices of the mandible in a brazilian population. ISRN Rheumatol. 2011;2011:854287. doi: 10.5402/2011/854287.
9. Camargo AJ, Arita ES, Fenandez MCC, Watanabe PCA. Comparison of two radiological methods for evaluation of bone density in postmenopausal women. Int J Morphol. 2015;33(2)732-6.
10. Kavitha MS, An SY, An CH, Huh KH, Yi WJ, Heo MS, et al. Texture analysis of mandibular cortical bone on digital dental panoramic radiographs for the diagnosis of osteoporosis in Korean women. Oral Surg Oral Med Oral Pathol Oral Radiol. 2015 Mar;119(3):346-56. doi: 10.1016/j.oooo.2014.11.009.
11. Calciolari E, Donos N, Park JC, Petrie A, Mardas N. Panoramic measures for oral bone mass in detecting osteoporosis: a systematic review and meta-analysis. J Dent Res. 2015 Mar;94(3 Suppl):17S-27S. doi: 10.1177/0022034514554949.
12. Klemetti E, Kolmakov S, Kroger H. Pantomography in assessment of the osteoporosis risk group. Scand J Dent Res. 1994 Feb;102(1):68-72.
13. Valerio CS, Trindade AM, Mazzieiro ET, Amaral TP, Manzi FR. Use of digital panoramic radiography as an auxiliary means of low bone mineral density detection in post-menopausal women. Dentomaxillofac Radiol. 2013;42(10):20120059. doi: 10.1259/dmfr.20120059.
14. Imirzalioglu P, Yuzugullu B, Gulsahi A. Correlation between residual ridge resorption and radiomorphometric indices. Gerodontology. 2012 Jun;29(2):e536-42. doi: 10.1111/j.1741-2358.2011.00514.x.
15. Taguchi A, Sanada M, Krall E, Nakamoto T, Ohtsuka M, Suei Y, et al. Relationship between dental panoramic radiographic findings and biochemical markers of bone turnover. J Bone Miner Res. 2003 Sep;18(9):1689-94.
16. Sindeaux R, Figueiredo PT, de Melo NS, Guimarães AT, Lazarte L, Pereira FB, et al. Fractal dimension and mandibular cortical width in normal and osteoporotic men and women. Maturitas. 2014 Feb;77(2):142-8. doi: 10.1016/j.maturitas.2013.10.011.
17. Oliveira ML, Pedrosa EFNC, Cruz AD, Haiter-Neto F, Paula FJA, Watanabe PCA. Relationship between bone mineral density and trabecular bone pattern in postmenopausal osteoporotic Brazilian women. Clin Oral Investig. 2013 Nov;17(8):1847-53. doi: 10.1007/ s00784-012-0882-2.
18. White SC, Cohen JM, Mourshed FA. Digital analysis of trabecular pattern in jaws of patients with sickle cell anemia. Dentomaxillofac Radiol. 2000 Mar;29(2):119-24.
19. Klemetti E. A review of residual ridge resorption and bone density. J Prosthet Dent. 1996 May;75(5):512-4.
20. Shrout MK, Hildebolt CF, Potter BJ. The effect of varying the region of interest on calculations of fractal index. Dentomaxillofac Radiol. 1997 Sep;26(5):295-8.
21. Arita ES, Pippa MG, Marcucci M, Cardoso R, Cortes ARG, Watanabe PCA, et al. Assessment of osteoporotic alterations in achondroplastic patients: case series. Clin Rheumatol. 2013 Mar;32(3):399-402. doi: 10.1007/s10067-012-2126-x.
22. Notelovitz M. Osteoporosis: prevention, diagnosis, and management. 5th ed. Washington: Professional Communications; 2008.
23. Lewiecki EM. Medications don't work if patients don't take them. South Med J. 2007 Dec;100(12):1190-1.
24. Liu H, Paige NM, Goldzweig CL, Wong E, Zhou A, Suttorp MJ, et al. Screening for osteoporosis in men: a systematic review for an American College of Physicians guideline. Ann Intern Med. 2008 May 6;148(9):685-701.
25. Klemetti E, Kolmakov S, Heiskanen P, Vainio P, Lassila V. Panoramic mandibular index and bone mineral densities in postmenopausal women. Oral Surg Oral Med Oral Pathol. 1993 Jun;75(6):774-9.
26. Kumasaka S, Kashima I. Initial investigation of mathematical morphology for the digital extraction of the skeletal characteristics of trabecular bone. Dentomaxillofac Radiol. 1997 May;26(3):161-8.
27. Link TM, Majumdar S, Grampp S, Guglielmi G, Van Kuijk C, Imhof H, Adams JE. Imaging of trabecular bone structure in osteoporosis. Eur Radiol 1999;9(9):1781-8.
28. Geraets WG, Van Der Stelt PF. Fractal properties of bone. Dentomaxillofac Radiol 2000 May;29(3):144-53.
29. Bollen AM, Taguchi A, Hujoel PP, Hollender LG. Fractal dimension on dental radiographs. Dentomaxillofac Radiol 2001 Sep;30(5):270-5.
30. Feltrin GP, Macchi V, Saccavini C, Tosi E, Dus C, Fassina A, et al. Fractal analysis of lumbar vertebral cancellous bone architecture. Clin Anat 2001 Nov;14(6):414-7.
31. Gurdal P, Hildebolt CF, Akdeniz BG. The effects of different image file formats and image-analysis software programs on dental radiometric digital evaluations. Dentomaxillofac Radiol 2001 Jan;30(1):50-5.
32. Jonasson G, Bankvall G, Kiliaridis S. Estimation of skeletal bone mineral density by means of the trabecular pattern of the alveolar bone, its interdental thickness, and the bone mass of the mandible. Oral Surg Oral Med Oral Pathol, Oral Radiol Endod 2001 Sep;92(3):346-52.
33. Wojtowicz A, Chaberek S, Kryst L, Urbanowska E, Ciechowicz K, Ostrowski K. Fourier and fractal analysis of maxillary alveolar ridge repair using platelet rich plasma (PRP) and inorganic bovine bone. Int J Oral and Maxillofac Surg 2003 Feb;32(1):84-6.
34. Leichter IS, Simkin A, Neeman V, Jabschinsky C, Schoenfeld D, Foldes AJ, et al. Optical processing of radiographic trabecular pattern versus bone mineral density of proximal femur as measures of bone strength. J Clin Densit 2001 Summer;4(2):121-9.
35. White SC, Rudolph DJ. Alterations of the trabecular pattern of the jaws in patients with osteoporosis. Oral Surg Oral Med Oral Pathol, Oral Radiol Endod 1999 Nov;88(5):628-35.
36. Rushton VE, Horner K, Worthington HV. Factors influencing the selection of panoramic radiography in general dental practice. J Dent 1999 Nov;27(8):565-71.
37. Yasar F, Akgünlü G. The diferences in panoramic mandibular indices and fractal dimension between patients with and without spinal osteopososis. Dentomaxillofacial Radiology 2006 Jan;35(1):1-9.
38. Slemenda C, Longcope C, Peacock M, Hui S, Johnston CC. Sex steroids, bone mass, and bone loss. A prospective study of pre-, peri-, and postmenopausal women. J Clin Invest 1996 Jan;97(1):14-21.
39. Watanabe PC, Faria, LM, Issa JP; Monteiro SA. Morphodigital evaluation of the trabecular bone pattern in the mandible using digitized panoramic an periapical radiographs. Minerva Stomatol 2009 Mar;58(3):73-80.
40. Oka K, Kumasaka S, Kashima I. Assessment of bone feature parameters from lumbar trabecular skeletal using mathematical morphology image processing. J Bone Miner Metab 2002;20(4):201-8.
41. Roberts MG, Graham J. Image texture in dental panoramic radiographs as a potential biomarker of osteoporosis. IEEE Trans Biomed Eng. 2013 Sep;60(9):2384-92. doi: 10.1109/TBME.2013.2256908.
42. Arifin AZ, Asano A, Taguchi A, Nakamoto T, Ohtsuka M, Tsuda M, et al. Computer-aided system for measuring the mandibular cortical width on dental panoramic radiographs in identifying postmenopausal women with low bone mineral density. Osteoporos Int. 2006;17(5):753-9.
43. Devlin H, Allen PD, Graham J, Jacobs R, Karayianni K, Lindh C, et al. Automated osteoporosis risk assessment by dentist: A new pathway to diagnosis. Bone 2007 Apr;40(4):835-42.
44. Devlin H, Karayianni K., Mitsea A, Jacobs R, Lindh C, Van der Stelt P, et al. Diagnosing osteoporosis by using dental panoramic radiographs the OSTEODENT Project. Oral Sur Oral Med Oral Pathol Oral Radiol Endod 2007 Dec;104(6):821-8.
45. Ruttimann UE, Webber RL, Hazelrig JB. Fractal dimension from radiographs of peridental alveolar bone. A possible diagnostic indicator of osteoporosis. Oral Surg Oral Med Oral Pathol 1992 Jul;74(1):98-100.
 Corresponding author:
Emiko Saito Arita
Departmento de Estomatologia, FO-USP
Av. Lineu Prestes, 2227
CEP: 05508-000 - São Paulo, SP, Brazil
E-mail: esarita@usp.br
Received for publication: June 21, 2016
Accepted for publication: October 17, 2016
